Tag: news

  • Invest Group Global Relocates to Abu Dhabi Global Market Under DB Group Holding

    Invest Group Global Relocates to Abu Dhabi Global Market Under DB Group Holding

    Invest Group Global, the DB Investing holding company, is proud to announce its official relocation from Seychelles to Abu Dhabi Global Market (ADGM) under the newly established DB Group Holding. This strategic move positions the company at the heart of one of the world’s most advanced financial centers, reinforcing its commitment to innovation, regulatory excellence, and sustainable growth. 

    ADGM, recognized as a leading international financial hub, offers a world-class regulatory framework and a dynamic business ecosystem, making it the ideal location for DB Group Holding’s next phase of international expansion. The relocation aligns with the company’s vision of building a diversified investment and financial services group with a strong presence in global markets in multiple regions. 

    Expanding Horizons with Strategic Partnerships 

    By establishing its headquarters in ADGM, DB Group Holding aims to attract strategic partners, institutional investors, and fintech innovators who share the company’s ambition for growth and excellence. The move provides access to a sophisticated financial infrastructure, a highly skilled talent pool, and a thriving ecosystem of investment firms, banks, and technology-driven enterprises. 

    “As an entrepreneur, I believe in continuously evolving and positioning our company where opportunities for strategic collaboration are abundant,” said Gennaro Lanza, Founder & CEO of DB Group Holding. “Abu Dhabi Global Market provides the perfect environment to forge strong partnerships with global investors, fintech leaders, and financial institutions that align with our vision. This relocation is a key step toward building a more robust and future-ready financial services group.” 

    DB Group Holding remains committed to expanding its investment portfolio, fostering innovation, and driving financial solutions that create long-term value for clients, partners, and stakeholders. With its new base in ADGM, the company is well-positioned to explore new opportunities across the Middle East, Asia, and beyond. 

    A Strategic Move for Long-Term Success 

    The decision to relocate to ADGM reflects DB Group Holding’s dedication to operating in a highly regulated and transparent financial environment. The UAE’s forward-thinking policies and commitment to fostering business growth make it a prime location for companies seeking to scale their global operations. 

    DB Group Holding will continue to focus on investment, fintech innovation, and strategic partnerships, leveraging the advantages of ADGM to accelerate its next phase of growth. The company invites investors, financial institutions, and fintech pioneers to join forces in shaping the future of global finance. 

    To explore investment opportunities and financial solutions under DB Group Holding, visit https://dbfinancial.ae/

  • Breaking News: Gold Hits New All-Time High of $2993.87 per Ounce

    Breaking News: Gold Hits New All-Time High of $2993.87 per Ounce

    In a remarkable move that has captured the attention of investors and traders around the globe, gold has surged to an unprecedented all-time high of $2993.87 per ounce. This historic milestone reflects growing investor demand for safe haven assets amid heightened market volatility and economic uncertainties.

    What’s Driving the Surge in Gold Prices?

    Several factors have contributed to this dramatic rise in gold prices:

    1. Global Economic Uncertainty

    Concerns over slowing global economic growth, persistent inflationary pressures, and geopolitical tensions have led investors to flock to safer assets like gold. Historically, gold has been considered a reliable hedge against inflation and currency devaluation.

    2. Central Bank Policies

    Central banks around the world continue to adjust their monetary policies in response to economic data. While some are maintaining high interest rates to control inflation, others are preparing to ease policies to stimulate growth. This divergence creates uncertainty in currency markets, increasing gold’s appeal as a stable store of value.

    3. Weakening US Dollar

    A recent decline in the US dollar index has made gold more affordable for international buyers, further boosting demand. A weaker dollar typically supports higher commodity prices, particularly precious metals.

    4. Safe-Haven Demand

    With geopolitical tensions escalating in various regions, risk sentiment in global markets has shifted. Investors are increasingly seeking the safety of gold to preserve capital during times of uncertainty.


    What Does This Mean for Traders and Investors?

    The record-breaking price of gold presents both opportunities and challenges for traders and investors:

    • For long-term investors, gold’s new highs reinforce its status as a critical component of a diversified portfolio. It offers protection against economic downturns and inflation.
    • For short-term traders, the increased volatility in gold markets can provide attractive trading opportunities. However, it also calls for careful risk management and strategy adjustments.

    Conclusion: Gold’s Rally Signals a Shift in Market Sentiment

    The surge in gold prices signals a pivotal moment in global markets. As uncertainty prevails, gold’s role as a safe-haven asset remains as strong as ever. Traders and investors should stay informed and agile, ready to capitalize on emerging opportunities.

    Stay tuned with DB Investing for the latest market news, expert insights, and trading strategies designed to help you succeed in today’s fast-moving markets.

  • From Gold to Bitcoin: A Wave of Sharp Declines Sweeps Across Markets

    From Gold to Bitcoin: A Wave of Sharp Declines Sweeps Across Markets

    Global financial markets have experienced a wave of sharp declines since yesterday, affecting various asset classes—from gold and stocks to oil and digital currencies. These significant downturns have raised concerns among investors and sparked questions about their causes and underlying factors. The common thread appears to be the widespread panic and uncertainty, prompting many to avoid risks and shift toward cash liquidity, which has impacted both safe-haven assets and risky assets alike. Below is an analytical look at the key factors behind the decline in gold, the pressure on U.S. stocks, the drop in oil prices, and the sudden collapse of digital currencies.

    Gold Loses Its Shine in the Face of Cash Liquidity

    Gold has traditionally been seen as a safe-haven asset during times of turmoil. However, in recent declines, it has lost some of its appeal. Despite prevailing uncertainty, many investors have preferred to hold cash rather than the yellow metal. Gold prices have notably fallen due to this shift in preference, as investors opted for liquidity in anticipation of opportunities in other assets that have dropped in value. Analysts suggest that this trend toward cash has led to widespread liquidation of gold holdings. Amid the broader market crash, some have sold gold to cover losses elsewhere or to strengthen their cash positions, contributing to the decline in gold prices despite economic uncertainty.

    U.S. Stocks Under Pressure: A Correction or the Beginning of a Crisis?

    The stock markets were not immune to the storm, with U.S. stocks facing intense selling pressure, raising concerns about the market’s direction. Major indices on Wall Street saw sharp declines, with the Dow Jones Industrial Average dropping over 2% and Nasdaq falling by about 4% in a single session. This rapid drop has revived the question of whether this is just a healthy correction following a long period of upward movement or the beginning of a deeper financial crisis.

    Several factors have driven this pullback in stocks, with one of the main causes being the escalation of tensions in the trade dispute between Washington and Beijing, along with the threat of new tariffs, which has sparked fears of a slowdown in global growth. Additionally, the uncertainty surrounding U.S. monetary and fiscal policy has heightened concerns about a potential economic recession. Under these pressures, many investors have opted to reduce their exposure to stocks and remain cautious until the outlook becomes clearer. Some analysts view the current drop as a temporary correction following a prolonged rise, while others warn that it may be an early warning sign of a deeper crisis if current conditions persist.

    Oil Between the Hammer of Supply and the Anvil of Demand

    In the energy market, oil has found itself between the hammer of abundant supply and the anvil of weakening demand. Oil prices have taken a clear hit amid global economic tensions and increased supply from producers. The decision by the OPEC+ alliance to continue increasing production has fueled a supply surplus at a time when global demand growth is slowing. In parallel, concerns about the trade dispute and an economic slowdown have led to downward revisions in energy demand forecasts. The result has been an imbalance between supply and demand—an oversupply of crude against weak demand—placing prices quite literally “between the hammer of supply and the anvil of demand.” In this situation, it’s not surprising that investors have temporarily pulled back from the oil market, waiting for greater economic clarity and a return to balance between production and consumption.

    Bitcoin and the Sudden Collapse: Vanishing Bullish Hopes?

    Even digital currencies were not spared from the global sell-off, with the largest of them, Bitcoin, experiencing a sudden drop that wiped out much of its previous gains. After a period of optimism that had taken Bitcoin to new record levels, the current downturn has dashed the hopes of many bulls. Bitcoin’s price fell by around 15% from its recent peak, dropping to nearly $80,000, and more than $350 billion of the market capitalization of digital currencies was lost. This occurred amid a global aversion to risk, with investors opting for cash and safe assets over high-volatility assets due to growing economic concerns. With this crash, expectations for a quick return to bullish momentum in this market have diminished—at least until the panic subsides and investors regain some confidence.

    In the end, these concurrent declines reveal the interconnectedness of global markets under the strain of negative sentiment: when fear dominates, cash liquidity reigns supreme, and even what is considered a safe-haven asset sees a decline. While the immediate losses have been severe, some may view them as paving the way for attractive buying opportunities at lower levels. The lingering question remains: Is what we’ve witnessed merely a passing storm that will be followed by a quick rebound, or are we at the beginning of a deeper crisis that will require greater caution in the coming period?

  • Tesla Stock Drops 5.6%, Erasing $50 Billion in Market Value in a Single Day 

    Tesla Stock Drops 5.6%, Erasing $50 Billion in Market Value in a Single Day 

    Tesla’s stock fell 5.6% during Thursday’s session, reaching its lowest level in over four months. This sharp decline resulted in the electric vehicle giant losing $50 billion in market capitalization in just one day. 

    With this drop, Tesla’s stock has returned to levels seen before Donald Trump’s victory in the U.S. presidential elections. 

    The losses followed a downgrade by brokerage firm Baird, which labeled Tesla as a “new bearish pick” and lowered its price target from $440 to $370. 

    Analysts have also warned of weaker-than-expected Tesla sales in the first quarter, suggesting that deliveries may fall short of market expectations. 

    What This Means for Investors 

    Tesla’s stock decline reflects growing concerns over demand and profitability amid increased competition in the EV market. The downgrade by Baird further pressures the stock, indicating potential downside risks ahead. 

    For traders and investors, monitoring key technical levels and market sentiment will be crucial in the coming weeks. Short-term volatility could present trading opportunities, while long-term investors may assess whether the dip offers a buying opportunity. 

    Stay updated with the latest market insights and trading signals at DB Investing. 

  • Breaking: Gold Hits New All-Time High of $2946.56 per Ounce: What does This Mean for Investors? 

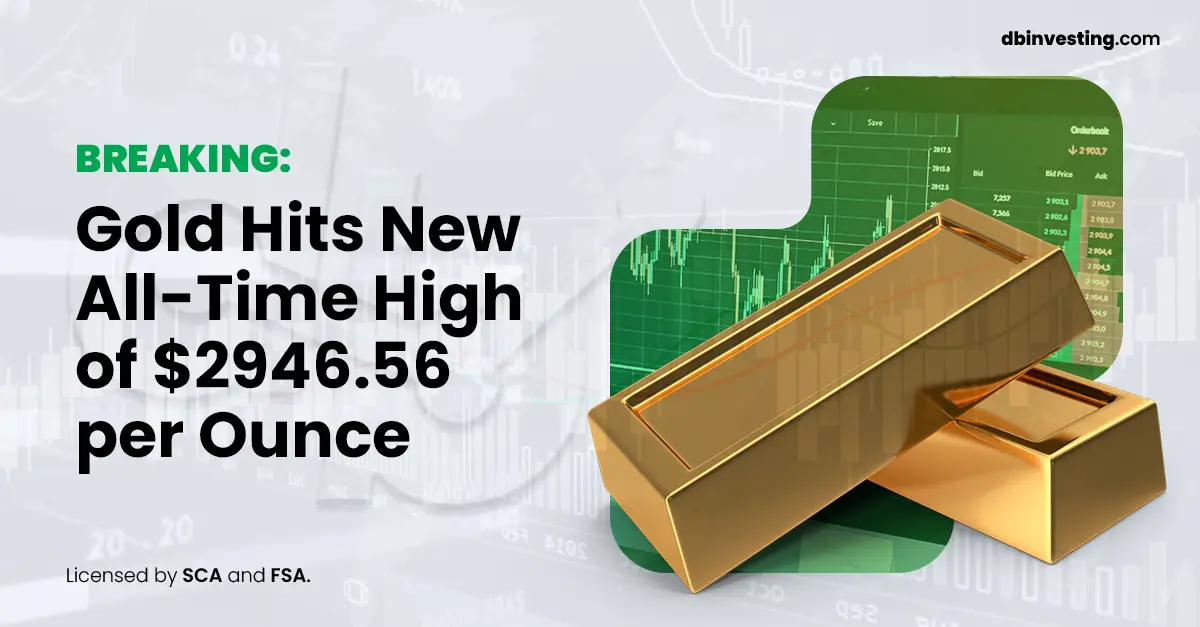
    Breaking: Gold Hits New All-Time High of $2946.56 per Ounce: What does This Mean for Investors? 

    The financial markets have witnessed a historic moment—gold has hit an all-time high of $2946.56 per ounce. This surge has sent shockwaves across the investment landscape, reinforcing gold’s role as the ultimate safe-haven asset. But what’s fueling this remarkable rise, and how can traders navigate this evolving market? Let’s break it down. 

    Why Is Gold Rising? 

    Several key factors are driving gold’s meteoric ascent: 

    🔹 Global Economic Uncertainty – With inflation concerns and geopolitical tensions rising, investors are shifting toward assets that hold intrinsic value. 

    🔹 Central Bank Strategies – Many central banks have increased gold reserves, further pushing demand. 

    🔹 Market Volatility – Fluctuations in stocks and forex markets have strengthened gold’s appeal as a hedge against uncertainty. 

    What This Means for Traders 

    The rise in gold prices presents both opportunities and risks. Here’s how traders can approach the market: 

    • Diversification is Key – Smart investors balance their portfolios with a mix of commodities, forex, and stocks to manage risk. 
    • Follow Market Trends – Understanding macroeconomic indicators and central bank policies can help in making informed trading decisions. 
    • Choose the Right Broker – Execution speed, liquidity access, and expert insights make a difference in volatile markets. 

    How DB Investing Helps You Stay Ahead 

    Navigating the financial markets requires more than just speculation—it demands knowledge, experience, and the right tools. DB Investing provides cutting-edge market insights, real-time data, and expert analysis to help traders capitalize on gold’s momentum. 

    Take the next step in your trading journey! Don’t miss out on market-moving opportunities.  

    Final Thoughts 

    Gold’s record-breaking rally is a wake-up call for traders and investors alike. Whether you’re an experienced investor or just starting out, understanding the forces behind these movements is crucial to making strategic decisions. 

    Stay ahead of the market with DB Investing—where expertise meets opportunity. 

  • TrumpCoin ($TRUMP) Now Available for Trading on DB Investing! 

    TrumpCoin ($TRUMP) Now Available for Trading on DB Investing! 

    We are excited to announce that TrumpCoin ($TRUMP) is now available for trading on DB Investing! 

    What is TrumpCoin? 

    • Launched on January 17, 2025, by Donald Trump, this meme coin has taken the crypto world by storm. 
    • In just two days, it reached a staggering market cap of nearly $13 billion, showcasing its volatility and potential for high returns. 

    Why Trade TrumpCoin? 

    🔹 Market Hype & Volatility – High price swings create big trading opportunities. 
    🔹 Built on Solana – Fast, low-cost transactions. 
    🔹 Community-Driven Growth – Meme coins thrive on momentum and speculation. 

    At DB Investing, we provide a secure, competitive platform with expert support to help you navigate the market. 

    Ready to dive in? Trade TrumpCoin ($TRUMP) now and explore the exciting opportunities it offers! 

  • Trump Between Political Comeback and Meme Coins

    Trump Between Political Comeback and Meme Coins

    The Game of Statements and cryptocurrency

    On January 20, 2025, Donald Trump returned to the White House, taking office as President of the United States for the second time. This return was marked by fiery statements and bold decisions that stirred controversy both nationally and internationally. However, what drew the most attention was not just his political agenda but the launch of two meme-based digital currencies by Trump and his wife, Melania. This move sparked intense debates about the influence of political figures on cryptocurrency markets and the risks these investments pose to individuals.

    Trump’s Statements: A New Golden Era or Renewed Challenges?

    In his inaugural address, Trump declared the beginning of a “new golden era” for America, promising to rebuild the economy and revitalize the domestic energy industry. Among his most controversial statements and decisions were:

    • Overturning the Previous Administration’s Policies:
      In an effort to erase the legacy of his predecessor, Trump signed executive orders to repeal 78 measures from Joe Biden’s administration, emphasizing the need to realign policies with his vision for America.
    • Freezing Regulatory Measures:
      Trump issued an order to freeze all new regulatory measures, stressing the need for a comprehensive review of existing policies to ensure alignment with his administration’s goals.
    • Ending Remote Work for Federal Employees:
      Trump directed the end of remote work policies for federal employees, insisting on their return to offices to enhance efficiency and productivity in government operations.
    • Withdrawing from the Paris Climate Agreement:
      Trump announced the United States’ withdrawal from the Paris Climate Agreement, arguing that the pact imposes unjustified restrictions on the American economy.
    • Declaring a National Emergency on the Mexican Border:
      Trump declared a national emergency on the southern border, outlining plans to deploy additional forces and enhance border security to curb illegal immigration. He also pledged to resume construction of the border wall and deport undocumented immigrants.
    • Liberalizing the Energy Sector:
      Trump declared an energy emergency, committing to removing restrictions on oil and gas extraction, including hydraulic fracturing (fracking), approving new pipelines, and reducing environmental regulations to boost energy independence.
    • Presidential Pardons:
      Trump signaled his intent to pardon participants in the January 6, 2021, Capitol riot, asserting the need to revisit their cases.

      These statements reinforced Trump’s image as a populist leader committed to restoring America’s economic and political dominance. Yet, amidst these political developments, Trump and Melania introduced a digital project that shocked financial markets.

    Meme Coins: “Trump Coin” and “Melania Coin” Take the Spotlight

    In an unexpected move, Trump and his wife launched two meme-based digital currencies, aptly named “Trump Coin” and “Melania Coin.” These coins were part of a marketing strategy leveraging Trump’s popularity and substantial influence over his support base.

    The coins witnessed a meteoric rise upon their launch. “Trump Coin” saw its value surge by over 1,000% within hours, fueled by social media promotions. Similarly, “Melania Coin” achieved record-breaking numbers in its initial days, becoming a hot topic in financial and media circles.

    However, this success was short-lived. The coins experienced a dramatic crash, losing more than 80% of their market value within days. This sudden collapse highlighted the risks associated with meme coins, which heavily rely on trends and fleeting fame without any substantial projects backing their value.

    Meme Coins: Opportunity or Trap?

    Meme coins, like “Trump Coin,” belong to a category of digital currencies driven by internet trends and social memes. Famous examples include “Dogecoin” and “Shiba Inu,” which have also experienced rapid surges in the past. However, the biggest challenge with meme coins lies in their lack of tangible value or economic foundation.

    Key Risks of Meme Coins:

    • Volatility: Their value heavily depends on social engagement, making them susceptible to abrupt crashes.
    • Lack of Supporting Projects: Most meme coins are not tied to robust technological or economic initiatives.
    • Emotional Investing: These coins attract investors seeking quick profits, often without adequate research or understanding of the risks involved.

    Trump’s foray into digital currencies reflects these challenges vividly. While “Trump Coin” witnessed an initial frenzy, its rapid downfall proved it to be a short-lived economic bubble.

    A Warning to Investors: Caution is Essential

    The story of “Trump Coin” and “Melania Coin” serves as a powerful reminder to investors that the digital market, despite its allure, is fraught with risks. To invest wisely in this space, consider the following tips:

    1. Conduct Research: Avoid investing based solely on trends or popularity. Understand the project behind the digital currency.
    2. Steer Clear of Emotional Decisions: Don’t let advertisements or celebrity endorsements drive your investment choices.
    3. Invest Cautiously: Allocate only a small portion of your funds to such coins and be prepared for potential losses.

    Conclusion

    Between his bold statements and the launch of meme coins, Donald Trump demonstrated how the intersection of politics and the digital economy can create both opportunities and risks. While some cryptocurrencies aim to deliver innovative solutions, meme coins remain a high-risk investment, often driven by rumors and trends. Investors must approach this market with wisdom and caution, recognizing that true success lies not in chasing bubbles but in deliberate planning and a long-term vision.

  • The Basics of Elliott Wave Theory

    The Basics of Elliott Wave Theory

    Introduction

    Elliott Wave Theory represents one of the most important tools in technical analysis of financial markets. This theory relies on a recurring pattern of movements that reflect the psychology of investors over time. It is an integral part of understanding how prices move across different markets, whether in forex, stocks, or commodities.

    Ralph Nelson Elliott discovered this theory in the 1930s when he noticed that markets move in specific, predictable patterns based on the psychological changes of market participants. Elliott believed that markets do not move randomly but follow defined patterns that can be read and analysed to predict future price movements.

    The Scientific Basis Behind the Theory

    Elliott Wave Theory is based on the principle that market movements are not random but follow common psychological cycles. According to Elliott, these cycles consist of impulsive waves that move in the direction of the primary trend of the market and corrective waves that move against it.

    Impulsive Waves

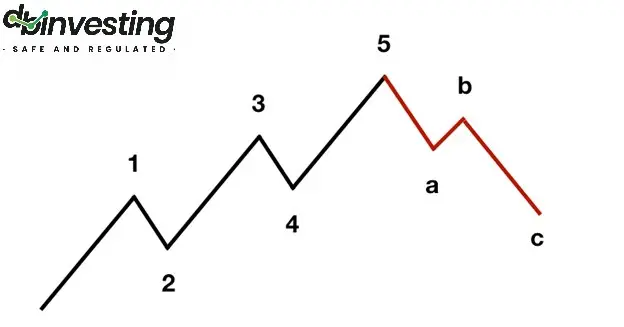
    Impulsive waves represent movements that move in the same direction as the market’s primary trend. These waves consist of five smaller waves, three of which move in the direction of the trend, and two are corrective.

    1. Wave One: This is the beginning of a new trend. This wave usually starts when investors begin buying after a period of market oversold conditions. This wave is often unclear to most investors, as it is considered a part of the correction rather than a new trend.
    2. Wave Two: This is a corrective wave following the first wave. It could be a slight pullback in the market as some investors take profits after the initial movement, but it doesn’t fully reverse the preceding upward movement.
    3. Wave Three: This is the longest and strongest of the waves. At this stage, most investors recognize that the market is in a new upward trend, which drives them to buy heavily, resulting in a significant rise in prices.
    4. Wave Four: This represents another corrective wave after the strong third wave. This wave is usually less severe than the second wave.
    5. Wave Five: This is the final phase of the impulsive movement. It can be weaker than the third wave, but it marks the end of the upward trend before the full correction begins.

    Corrective Waves

    After the impulsive waves end, the market enters a corrective phase consisting of three waves, known as the corrective waves (A-B-C).

    1. Wave A: This is the beginning of the correction after the fifth wave ends. At this stage, investors begin taking profits, leading to a drop in prices.
    2. Wave B: This is an upward retracement within the corrective trend. Some might believe that the market will resume its upward trend, but it is a corrective wave within the correction.
    3. Wave C: This is the final stage of the correction, where the correction is completed, and prices decline further, setting the market up for a new impulsive wave.


    Fractals and Wave Patterns

    One of the distinguishing features of Elliott Wave Theory is the concept of fractals. This refers to the fact that each impulsive and corrective wave consists of smaller waves within it. For example, Wave One could be made up of five smaller waves, with each of those smaller waves following the same structure as the larger waves. This makes the market analysable at multiple time frames, from short periods like minutes to long periods such as years.

    The Relationship Between Elliott Waves and Fibonacci
    Elliott Wave Theory is closely linked to the Fibonacci sequence. The theory uses Fibonacci ratios to predict potential reversal or correction points in the market. For example, ratios like 38.2% and 61.8% can be used to identify key support and resistance levels. Often, corrective waves end at these levels.

    How to Use Fibonacci Ratios with Elliott Waves
    When the market completes an impulsive wave (Waves 1-5), traders can use Fibonacci ratios to determine potential corrective levels for the A-B-C wave. For example, if a trader expects the market to enter a corrective phase, they can draw Fibonacci ratios from the top of Wave Five to the bottom of Wave One to identify possible correction levels.

    Applying Elliott Waves in Trading
    Elliott Waves is a powerful analytical tool that can be used to identify optimal trading opportunities. By understanding the wave movements, traders can pinpoint the best entry and exit points in the market. Here are some examples of how to apply Elliott Waves in trading:

    1. Identifying the Market’s Main Trend
      By analyzing the impulsive and corrective waves, traders can determine whether the market is in an uptrend or downtrend. When the five-wave pattern is completed, a corrective phase can be expected, providing an opportunity for traders to take advantage of the upcoming trend.
    2. Capitalizing on Corrections
      Elliott Waves can be used to forecast potential correction levels. For instance, if a trader expects that the market has completed an impulsive wave, they can use Fibonacci ratios to identify possible correction levels for the A-B-C wave.
    3. Optimal Timing for Entry and Exit
      When the wave pattern is completed, it can serve as a signal for traders to enter or exit the market. For example, if Wave C is completed, it can signal a market entry, as traders expect the market to begin a new impulsive phase.
    4. Combining Elliott Waves with Other Technical Indicators
      The accuracy of Elliott Wave predictions can be enhanced by using them alongside other technical indicators. For example, traders can use moving averages or the Relative Strength Index (RSI) to better identify entry and exit points.

    Practical Examples of Applying Elliott Wave Theory


    Example 1: Trading a Correction After an Uptrend in EUR/USD
    Let’s take an example from the forex market. If you are trading the EUR/USD pair and notice that the price has risen significantly over several weeks, you can analyze this rise using Elliott Waves. The movement can be broken down into five impulsive waves, and once Wave Five is completed, a potential correction phase may begin.
    Once Wave Five is complete, Fibonacci ratios can be used to identify potential correction levels. If the price retraces to the 61.8% level, it may signal that the market has completed its correction and is about to enter a new impulsive wave.

    Example 2: Uptrend in Tesla Stock
    When trading Tesla’s stock, the price may begin an upward movement after a positive earnings announcement. The movement can be broken down into five impulsive waves according to Elliott Waves. Wave One represents the beginning of the new trend after a period of consolidation, and Waves Three and Five continue to push prices higher with strong momentum. During these waves, traders can enter buy positions in each impulsive wave, increasing their chances of profit.

    Challenges of Applying Elliott Wave Theory
    Despite its numerous benefits, traders may face some challenges when applying Elliott Wave Theory:

    • Difficulty in Accurately Identifying Waves
      Identifying waves accurately can be challenging, especially in volatile markets. The market may display confusing patterns, making it difficult to determine which wave the market is currently in.
    • The Need for Extensive Experience
      Elliott Wave Theory requires a substantial amount of knowledge and experience. Traders need to carefully analyze the market and rely on personal judgment, which may lead to differing interpretations among analysts.
    • Relying on Other Tools
      Elliott Wave Theory may not be sufficient on its own. Traders need to combine it with other analytical tools to confirm their predictions and avoid losses.

    Criticisms of Elliott Wave Theory
    Despite its popularity, Elliott Wave Theory has been criticized by some traders and analysts. They argue that the theory can be overly complex and relies on subjective interpretations. Some critics believe that attempts to identify waves may be prone to errors in volatile markets.
    However, many traders still consider this theory a valuable analytical tool that helps them understand market movements and capitalize on trading opportunities.

    Conclusion
    Elliott Wave Theory is a powerful analytical tool that provides a framework for analysing recurring market movements. Although it faces some challenges, when used correctly, it can be extremely useful in analysing financial markets and identifying optimal trading opportunities.

    At DB Investing, we believe that mastering this tool can empower traders to make informed decisions and capitalize on market opportunities. Whether you’re a novice or an experienced trader, incorporating Elliott Waves into your strategy could be the key to unlocking your trading potential.

  • Analysis of Fibonacci Levels and Their Use in Financial Trading

    Analysis of Fibonacci Levels and Their Use in Financial Trading

    Introduction

    At DB Investing, empowering traders with effective tools and strategies is at the core of what we do. Among these tools, Fibonacci levels stand out as a widely used method to identify potential support and resistance areas in the financial markets. Named after the Italian mathematician Leonardo Fibonacci, these levels are horizontal lines derived from Fibonacci percentages—23.6%, 38.2%, 61.8%, and 78.6%. The commonly used 50% ratio, though not a Fibonacci number, is also considered an essential reference for traders.

    Importance of Fibonacci Levels

    Fibonacci levels offer a method to analyze market movements by connecting two significant price points, such as the highest and lowest prices, and drawing retracement levels between them. At DB Investing, we believe traders can enhance their strategies by mastering these levels to forecast potential market reversals and continuations.

    The General Formula for Fibonacci Levels and How to Calculate Them

    Fibonacci retracement levels are calculated using the Fibonacci sequence, which follows a specific formula. The sequence starts with 0 and 1, and each subsequent number is the sum of the two preceding ones:

    • F(0) = 0
    • F(1) = 1
    • F(n) = F(n-1) + F(n-2) for n > 1

    Where:

    • F(n) is the number that appears at the nth position in the Fibonacci sequence.
    • F(0) equals 0.
    • F(1) equals 1.
    • F(n) is calculated by adding the previous two numbers to obtain the next number in the sequence (F(n-1) + F(n-2)).

    Fibonacci Sequence Overview:

    • F(0) = 0
    • F(1) = 1
    • F(2) = F(1) + F(0) = 1 + 0 = 1
    • F(3) = F(2) + F(1) = 1 + 1 = 2
    • F(4) = F(3) + F(2) = 2 + 1 = 3
    • F(5) = F(4) + F(3) = 3 + 2 = 5

    Thus, each number is the sum of the two preceding numbers: 0, 1, 1, 2, 3, 5, 8, 13, 21, 34, 55, 89, 144, 233, 377, 610, and so on. This series continues infinitely, and any number in the sequence can be calculated by adding the two previous numbers.

    Insights from Fibonacci Levels

    At first glance, everything in this sequence appears natural. However, there is a fascinating relationship discovered in the connection between consecutive numbers. This relationship is observed not only in the Fibonacci sequence but also in various aspects of human life, nature, and even the smallest parts of the human body, such as chromosomes.

    The Fascinating Relationship in the Sequence

    It is worth noting that the results of the mathematical process in the relationship between numbers in any arithmetic sequence will always yield the same result, no matter how the sequence is formulated. This relationship has been found in numerous other phenomena related to human life, aesthetics, and even in the smallest parts of the human body, like chromosomes, which humans rely on for their natural functions. This relationship has also been observed in the largest galaxies in the universe and throughout nature.

    The mathematical operation involves dividing a number by the one that precedes or follows it, as follows: 0, 1, 1, 2, 3, 5, 8, 13, 21, 34, 55, 89, 144, 233, 377, 610…

    • Dividing any number by the next one results in approximately 0.618.
      • 610 / 377 = 1.618
      • 233 / 144 = 1.618
      • 89 / 55 = 1.618
    • Dividing the previous number by the current one results in approximately 1.618.
      • 377 / 610 = 61.8
      • 144 / 233 = 61.8
      • 55 / 89 = 61.8

    Excess Fibonacci Levels

    What if we reverse the mathematical operation so that the previous number is divided by the next one: 0, 1, 1, 2, 3, 5, 8, 13, 21, 34, 55, 89, 144, 233, 377, 610…

    • 377 / 610 = 61.8
    • 233 / 144 = 61.8
    • 144 / 233 = 61.8

    By reversing the operation, we still get a constant value of 61.8.

    What if we divide a number by a number two positions before it in the sequence?

    • 610 / 233 = 2.618
    • 144 / 55 = 2.618
    • 89 / 34 = 2.618

    We see the number has changed from 1.618 to 2.618, where the difference between 1 and 2 represents the difference in the numbers being divided. If we reverse the division, the result is 38.2.

    If we divide a number by one with a two-step difference, the result is 4.236:

    • 610 / 144 = 4.236
    • 233 / 55 = 4.236

    Reversing the division gives 0.236:

    • 144 / 610 = 0.236
    • 55 / 233 = 0.236

    Conclusions

    From the above, we can conclude that dividing any arithmetic sequence by itself yields constant results that never change, and these results are considered laws and constants.

    The Relationship in the Market

    These constants can be seen everywhere, as mentioned earlier. But the question is: what do they represent in the market, and how can they be useful?

    It is known that market patterns and events depend on two factors: time and price movement, which form patterns. These movements are always constant and not random, and their outputs are predictable. Therefore, Fibonacci numbers are used for their stability in mathematical outputs, as explained earlier. But what does each number mean?

    Before explaining further, we must reference the relationship in the mathematical operations for the results of the numbers: 423.6, 261.8, 161.8, 61.8, 38.2, 23.6

    If we divide these numbers by each other, we get the same results as in the previous operations:

    • 23.6 / 38.2 = 0.618
    • 38.2 / 23.6 = 1.618
    • 423.6 / 261.8 = 1.618
    • 38.2 / 23.6 = 1.618

    We observe that the results of the mathematical operations in the sequence are also equal to the initial outputs. This consistency is based on the previous mathematical principle and demonstrates the stability in the results of arithmetic sequences, or what is referred to as the golden ratio 61.8 and 161.8.

    The Golden Ratio

    What do the golden ratios 61.8 and 161.8 represent? As demonstrated, 61.8 is the result of two consecutive numbers in the arithmetic sequence, and 161.8 is the reverse of the same process. These are identical outcomes from dividing the results of these operations. If we consider a specific price movement between 0% and 100%, the constant ratios in the sequence are 23.6%, 38.2%, and 61.8%, all within the complete movement from 0% to 100%. However, the numbers 161.8%, 261.8%, and 423.6% are outside the full range represented by 0% to 100%, and are therefore called price extension numbers.

    Thus, the numbers 161.8, 261.8, and 423.6 represent extension levels, where the price is expected to reach if it breaks out of a certain price movement range beyond the 0% to 100% range.

    Setting and Installing Fibonacci Levels

    There are various types of Fibonacci levels that can be used, such as Fibonacci Channels, Fans, and others, but it is recommended to use Fibonacci Retracement levels. These levels are drawn by connecting the highest and lowest points (the highest and lowest price points) within a certain period, and they represent key support and resistance areas.

    Installing the Tool on MetaTrader 4

    You can install and draw this tool on MetaTrader 4 or 5 using one of two methods:

    1. Find the “Draw Fibonacci Retracement” option in the top toolbar of the platform.
    2. From the Insert menu in the top bar of the platform, you will find the Fibonacci option, then select Retracement.

    Advantages and Disadvantages of Using Fibonacci Levels in Trading

    Advantages

    • Helps identify potential support and resistance areas in the market.
    • Provides important time ratios for price movement projections and potential extension and retracement periods.
    • Increases traders’ confidence when a potential price reversal aligns with key Fibonacci levels.
    • Both beginners and professional traders can benefit from Fibonacci levels.

    Disadvantages

    • Some traders may initially find it difficult to correctly understand and apply Fibonacci levels.
    • Relies on historical price analysis and may not always be accurate, especially during rapid market changes.
    • Requires additional indicators to confirm the validity of signals.

    Conclusion

    At DB Investing, we view Fibonacci levels as a powerful tool for traders aiming to refine their strategies. Success with Fibonacci levels hinges on combining technical knowledge with comprehensive market analysis. By leveraging these insights, traders can navigate financial markets with increased confidence and precision. The effectiveness of using Fibonacci levels depends on the trader’s skills and experience and their ability to analyse the market comprehensively. Fibonacci levels should be viewed as an additional tool in the decision-making process, not as a substitute for relying on thorough research and market analysis


  • DB Investing is attending IFX Expo Dubai 2025 – Let’s Connect!

    DB Investing is attending IFX Expo Dubai 2025 – Let’s Connect!

    We are thrilled to announce that DB Investing is attending the IFX Expo Dubai 2025, the world’s premier fintech and online trading event. Taking place from January 14–16, 2025, at the Dubai World Trade Centre, this event brings together industry leaders, innovators, and professionals to shape the future of trading.  

    Why Attend IFX Expo Dubai 2025? 

    As the largest fintech expo of its kind, IFX Expo Dubai serves as a hub for collaboration, exploration, and growth. The event brings together brokers, technology providers, IBs, fintech firms, and industry professionals under one roof, offering unparalleled networking opportunities. This year, DB Investing is proud to join this prestigious gathering to showcase how we empower traders worldwide. 

    What to Expect? 

    with DB Investing’s, you’ll experience: 

    • Innovative Trading Solutions: Explore the cutting-edge tools and services we offer to elevate trading strategies. 
    • Expert Insights: Connect with our knowledgeable team to discuss trends, challenges, and opportunities in online trading and fintech. 
    • Collaborative Opportunities: Let’s discuss how we can work together to shape your trading future. 

    Save the Date 

    📅 When: January 14 to 16, 2025  

    📍 Where: Dubai World Trade Centre 

    Mark your calendars and don’t miss this opportunity to meet us in person! Whether you’re looking for trading solutions, fintech insights, or a platform to collaborate, DB Investing is here to help you achieve your goals. 

    Stay Updated 

    Follow us for live updates, event highlights, and more exciting announcements leading up to the expo.