Tag: guide

  • 10 Books You Can’t Miss to Become a Successful Forex Trader (Part 2)

    10 Books You Can’t Miss to Become a Successful Forex Trader (Part 2)

    After reviewing three of the best books in Part 1 that can help you build a strong foundation for Forex trading, it’s time to dive deeper. In this section, we will highlight three more books that represent a significant shift in your understanding of the markets and your development as a trader.

    These books offer new ideas and innovative methods that cover various aspects of trading, from strategies for achieving sustainable profits to handling the psychological side of trading to ensure smart decision-making under pressure. These books are not just sources of knowledge; they are tools that will empower you to refine your style and achieve greater success in the world of Forex.

    If you’re serious about improving your trading abilities, these three books will be a crucial step toward achieving your goals. Get ready to explore more Forex secrets and open new horizons in your professional journey!

    1. How to Make a Living Trading Foreign Exchange by Courtney Smith

    If you’re looking to turn Forex trading from a hobby into a sustainable source of income, How to Make a Living Trading Foreign Exchange by Courtney Smith provides a comprehensive roadmap to achieve this goal.

    Courtney Smith, known for his deep expertise in the financial markets, reveals in this book the essentials every trader needs to understand the Forex market professionally. The book delves into six key strategies designed to help traders achieve consistent profits. One of the standout strategies is the “Rejection Rule,” an innovative method that seeks to multiply profits by enhancing the traditional trading channel breakout system, giving traders an additional advantage in the market.

    In addition, the book covers other crucial aspects such as risk management and dealing with the psychological pressures associated with trading. Smith offers practical tools and methods to help you overcome fears and enhance self-discipline, both of which are fundamental elements for success in any financial market.

    What sets this book apart is the balance between theoretical and practical aspects, with strategies presented in an easy-to-understand manner, along with real-life examples that help in applying them effectively. If you’re looking for a comprehensive guide to turning your passion for trading into a profitable and sustainable career, this book will be an indispensable addition to your library.

    2. Japanese Candlestick Charting Techniques by Steve Nison

    If you’re seeking a deeper understanding of charts and how to analyse markets using technical analysis tools, Japanese Candlestick Charting Techniques by Steve Nison is an essential classic guide. This book provides a detailed approach to using Japanese candlestick charts, a proven analytical tool in many financial markets like Forex, stocks, futures, and even commodities.

    What makes this book stand out is that it doesn’t just offer a technical explanation of candlesticks but also integrates them with other technical tools to provide a comprehensive market analysis view. You’ll learn how to correctly interpret candlestick patterns and use them to predict price movements, giving you a competitive edge as a trader.

    Steve Nison, regarded as one of the foremost experts in this field, based his book on many years of research and trading experience. He explains various candlestick patterns in a practical and realistic way, making this book ideal for traders at all levels, whether you’re a beginner or a professional.

    If you’re looking to add a powerful analytical tool to your trading arsenal, this book will lay the foundation for understanding Japanese candlestick charts and effectively using them to improve your decisions and strategies. Steve Nison’s book is not just an enjoyable read; it’s a true investment in your success as a trader and analyst.

    Before continuing to read, seize the unique opportunity to enhance your trading skills with Db Investing by taking their free online trading course! Learn directly from professional trading experts, discover the best trading strategies, how to use the most effective indicators, and get practical tips for trading in live markets. Don’t miss out on this chance to boost your knowledge and experience in the financial markets. Click here to register for free and start your journey toward success today!

    3. Currency Forecasting by Michael Rosenberg

    If you want to understand how to forecast currency movements in Forex markets more accurately, Currency Forecasting by analyst Michael Rosenberg is a classic reference that deserves a place in your library.

    What sets this book apart is the author’s ability to combine technical analysis with fundamental analysis, a rare and necessary blend for any trader aiming to understand the underlying dynamics behind market movements. Michael Rosenberg, with his experience as an analyst at Merrill Lynch, presents a unique approach to currency analysis by highlighting how monetary and economic factors influence exchange rates, helping traders predict market movements with confidence.

    This book is not only an excellent resource for beginners but also an advanced guide for professionals who wish to refine their strategies. You will learn how to combine fundamental analysis, such as monetary policies and economic factors, with technical analysis, such as charts and patterns, to create a comprehensive market forecast.

    Currency Forecasting is more than just an educational book; it’s a powerful tool that gives you the ability to absorb the market more deeply and make smarter trading decisions. If you’re serious about improving your skills as a trader, this book is a necessary step toward enhancing your understanding and achieving success in the Forex market.

    With our review of three additional books in this section, you now have advanced knowledge tools to better understand the markets and analyse movements with more precision and professionalism. The books we’ve discussed are not just educational sources; they are gateways to a whole new world of opportunities and possibilities that can transform the way you approach the Forex market.

    But the journey doesn’t end here! In Part 3, we will take you to a more advanced stage, where we will review four more books with strategies and ideas designed for traders who aim to excel. Get ready to discover innovative trading methods and invaluable tips from Forex experts. Stay tuned to complete this series and firmly step toward success in the financial markets!


  • Comprehensive Trading Guide (Part 3)

    Comprehensive Trading Guide (Part 3)

    Risks and Benefits in the Forex Market

    Benefits of Forex Trading
    The forex market offers many advantages that make it appealing to traders worldwide. Here are the key benefits:

    1. High Liquidity
      The forex market is the largest in the world in terms of daily trading volume, with trillions of dollars being traded every day. This high liquidity means traders can easily open and close positions without delay, with competitive price spreads (low spread).
    2. 24-Hour Trading
      Unlike other financial markets, the forex market operates 24 hours a day, five days a week. Trading starts with the opening of Asian markets on Monday and ends with the closure of U.S. markets on Friday. This flexibility allows traders worldwide to trade at times that suit them.
    3. Leverage
      Traders can use leverage to control larger positions with less capital. For example, with a 1:100 leverage, a trader can open a $100,000 position with only $1,000. While this can significantly increase profits, it also increases risks.
    4. Variety of Financial Instruments
      In the forex market, traders can trade a wide range of currencies, including major, minor, and exotic pairs. They can also trade CFDs on indices, precious metals, commodities, and stocks.
    5. Low Costs
      Compared to other financial markets, forex trading costs are low. The main cost is the spread, which is often very small in major pairs. There are usually no additional commissions on standard accounts, making forex trading affordable.
    6. Decentralized Trading
      With platforms like MetaTrader 5 available on smartphones and tablets, traders can monitor the market and execute trades from anywhere at any time.

    Risks of Forex Trading
    Despite the many benefits, forex trading also carries risks that traders need to be aware of:

    1. High Leverage
      Although leverage is a major advantage, it also presents a high risk. Using leverage increases the potential profits but also amplifies losses. A trader may face significant losses if leverage is not used carefully.
    2. High Volatility
      The forex market is known for its large price fluctuations. While these fluctuations can present opportunities for profit, they also carry the risk of quickly losing capital if the market moves against the trader’s expectations.
    3. Economic and Political Instability
      Currency prices are influenced by various economic and political factors. Sudden changes in government policies or bad economic news can lead to unexpected market movements, increasing risks for traders.
    4. Psychological Risks
      Trading can have a significant impact on a trader’s mental state. Hasty decisions or emotional trading can lead to unexpected losses. Self-management and discipline are crucial for success in this market.
    5. Risks Related to the Broker
      Choosing an unreliable broker can expose traders to additional risks, such as slow order execution or lack of transparency in costs. It is important to choose a licensed and regulated broker, like db investing, to ensure capital protection.

    How to Reduce Risks in the Forex Market

    • Learning and Training
      Before starting real trading, it is important for traders to master different trading strategies and understand the risks involved. Using a demo account is a key step for risk-free practice. At db investing, we offer a series of free training webinars to help you enter the markets properly.
    • Capital Management
      Determining the level of risk a trader can take in each trade is an essential part of capital management. Traders should risk only a small percentage of their capital per trade to avoid large losses.
    • Using Stop-Loss Orders
      Placing stop-loss orders allows traders to limit losses if the market moves against their expectations.
    • Emotional Control
      Traders should maintain discipline and avoid letting emotions like greed or fear affect their decisions. Sticking to a trading plan helps avoid emotional trading.

    While forex trading offers great profit potential due to high liquidity and leverage, it also carries significant risks. Success in this market depends on the trader’s ability to manage risks effectively and stick to a disciplined trading plan.

    Best Trading Times
    Understanding the best times to trade
    The forex market operates 24 hours a day, five days a week. However, certain times during the day see higher liquidity and greater volatility, providing better opportunities for traders. The best time to trade depends on the timing of global financial markets, and the forex trading day is divided into four main sessions:

    1. Sydney Session (Australian Markets)
      The Sydney session starts at 10:00 PM GMT and ends at 7:00 AM GMT. This session is relatively quiet due to lower trading volume compared to other sessions. However, there may be good opportunities to trade the Australian Dollar (AUD) and New Zealand Dollar (NZD).
    2. Tokyo Session (Asian Markets)
      The Tokyo session starts at 12:00 AM GMT and ends at 9:00 AM GMT. Liquidity is high in this session, especially in currency pairs related to the Japanese Yen (JPY), such as USD/JPY and EUR/JPY. The session also sees strong volatility in Asian markets.
    3. London Session (European Markets)
      The London session starts at 8:00 AM GMT and ends at 5:00 PM GMT. This session is one of the most active in the forex market, as London is a major financial hub. It features very high liquidity and strong volatility, especially in currency pairs involving the British Pound (GBP) and Euro (EUR).
    4. New York Session (U.S. Markets)
      The New York session starts at 1:00 PM GMT and ends at 10:00 PM GMT. This session sees significant activity, especially in currency pairs involving the U.S. Dollar (USD) such as EUR/USD and GBP/USD. This session is very important, particularly when major economic news from the U.S. is released.

    Overlapping Sessions
    The best times to trade usually occur during the overlapping periods between different market sessions. These periods are characterized by high liquidity and trading volume, leading to better profit opportunities. There are two main overlaps:

    1. London-New York Overlap
      This overlap occurs between 1:00 PM and 5:00 PM GMT. It is the most active overlap in the forex market, as two of the largest financial markets are in play, resulting in high liquidity and strong volatility.
    2. Tokyo-London Overlap
      This overlap happens between 8:00 AM and 9:00 AM GMT. While it is less active compared to the London-New York overlap, it can still offer opportunities for trading Asian currencies like the Japanese Yen (JPY).

    Best Times to Trade Different Currency Pairs
    Each currency pair is affected by the activity of different markets based on the countries they represent:

    • EURUSD: Best traded during the London session and its overlap with New York, when liquidity is at its highest.
    • USDJPY: This pair is particularly active during the Tokyo session and its overlap with London.
    • GBPUSD: Best traded during the London session and its overlap with New York.
    • AUDUSD: Best traded during the Sydney session and its overlap with Tokyo.

    Trading During Economic News
    Important economic news like unemployment reports, inflation, and central bank decisions can lead to large market fluctuations. These news releases can be some of the best times for quick profits in forex. However, caution is needed because these fluctuations can also lead to large losses if risks are not properly managed.

    Conclusion
    The best times to trade depend on the currency pairs you are trading and the sessions you prefer. It is important to track the overlap periods and major economic news releases to make the most of trading opportunities. Trading during high liquidity and high volatility periods can help make profits but always use risk management tools to protect your capital.

    In part three, we reviewed the key features and risks of the forex market, along with how to reduce those risks. We also explored the most important trading times and how to take advantage of them for better results in trading.

    In part four, we will create a trading plan. We’ll learn how to design a well-thought-out plan, set clear goals, choose a suitable trading style, and manage risks smartly. We’ll also discuss the importance of proper financial management through following basic principles and using effective strategies and tools for managing capital and controlling risk ratios.

  • Tips from Top Investors

    Tips from Top Investors

    Part Two: Ray Dalio

    Who is Ray Dalio?
    Ray Dalio is one of the greatest investors of our time and the founder of Bridgewater Associates, the largest hedge fund in the world, managing assets exceeding $150 billion USD.
    Dalio began his career in financial markets at an early age, investing his first amount in the stock market when he was just 12 years old. What sets him apart from other investors is his principle-based investment philosophy, where he believes that success in the markets depends on a clear understanding of reality and working systematically according to precise rules.
    Dalio is not only a successful investor but also a brilliant thinker. His book Principles is one of the bestsellers, in which he shares his philosophy on life, work, and investing.

    Ray Dalio’s Wealth
    Ray Dalio’s net worth is estimated at around $19 billion USD, according to the latest statistics. This wealth reflects his ability to make smart investment decisions and lead his team to achieve sustainable profits, even during economic crises.
    Dalio’s success was not just a matter of luck; it is the result of decades of commitment and learning from mistakes, which has made him one of the most prominent names in global investment.

    Ray Dalio’s Key Investment and Financial Success Tips
    Ray Dalio believes that success in financial markets requires a clear strategy based on precise analysis and a deep understanding of economic factors. Here are his top tips:

    1. Embrace Reality and Accept Mistakes
      His famous phrase, “Pain + Reflection = Progress,” reflects his philosophy in facing failure.
      Dalio believes that acknowledging mistakes and learning from them is the best way to grow both as an individual and an investor. For him, ignoring reality is the biggest mistake an investor can make.
    1. Diversification is Key
      Dalio emphasizes the importance of diversification to reduce risks and increase the chances of success.
      He says, “Don’t put yourself at the mercy of one type of investment.”
      He advises distributing assets across stocks, bonds, and commodities, with attention to balancing risks and returns.
    2. Focus on the Big Picture
      Dalio is known for his ability to analyse macroeconomic trends.
      He says, “Understand how the economic machine works.”
      He believes that a successful investor is one who makes decisions based on global economic events such as inflation, interest rates, and monetary policies.
    3. Stay Flexible and Prepare for the Worst
      Ray Dalio always recommends expecting crises and preparing for them.
      During crises, such as the 2008 financial crisis, Dalio managed to make massive profits through smart hedging and prudent risk management.
      His advice: “Plan for the worst-case scenarios and be prepared to adapt.”
    4. Continuous Learning is the Secret
      Dalio says, “Success is an endless learning journey.”
      Whether you’re a beginner or an expert, you must continue to learn from the markets, books, and personal experiences. For him, knowledge is the greatest asset of an investor.

    Ray Dalio is not just a successful investor; he is a role model in strategic thinking and risk management. His principle-based investment philosophy can serve as a guide for anyone seeking to achieve financial success and invest wisely.


    If you want to improve your investments, always remember his advice: “Be realistic, diversified, and prepared for any challenges that may come.”


    “Learn from mistakes and keep learning” — that’s how you become a successful investor the Ray Dalio way.

  • A Comprehensive Guide to Forex Trading

    A Comprehensive Guide to Forex Trading

    Part Two

    How to Get Started in Forex Trading

    Steps to Open a Trading Account
    To begin trading in the forex market, traders need to take several essential steps to open a trading account. Here are the steps to follow:

    1. Choose a Suitable Forex Broker
      The first step is selecting a reliable and licensed broker for forex trading. It’s important to choose a broker that provides a secure and transparent trading environment, along with competitive spreads and excellent customer support services.
    2. Register and Open an Account
      After selecting the right broker, you’ll need to register to open an account. You will need to provide personal information such as your name, address, and email, along with submitting proof of identity according to regulatory requirements.
    3. Choose the Type of Account
      Most brokers offer multiple types of accounts (demo accounts and live accounts). A demo account is an excellent option for beginners to practice trading risk-free. Once you feel ready, you can open a live account.
    4. Deposit Funds
      After opening a live account, you will need to deposit the capital you intend to trade with. Most brokers offer several deposit methods such as bank transfers, credit cards, or e-wallets.
    5. Download the Trading Platform
      Most brokers provide online trading platforms or apps that can be downloaded on mobile devices. MetaTrader 5 is the most popular and widely used platform for forex trading.
    6. Start Trading
      Once your account is funded and the trading platform is downloaded, you can start placing buy and sell orders based on the analysis you’ve conducted.

    Advantages of Opening an Account with DB Investing
    DB Investing is one of the prominent brokers in forex trading and Contracts for Difference (CFDs). Here are some advantages that make it an ideal choice for traders:

    1. Regulation and Licensing
      DB Investing is licensed by the Financial Services Authority (FSA) in Seychelles and the Securities and Commodities Authority (SCA) in the UAE, ensuring the company operates within a strict regulatory framework that protects traders’ rights and promotes operational integrity.
    2. Wide Range of Tradable Assets
      DB Investing offers a variety of financial instruments for trading, including:
      Forex currency pairs
      – Precious metals like gold and silver
      – Global indices
      – Commodities like oil and natural gas
      – CFDs on stocks and exchange-traded funds (ETFs)
      – Cryptocurrencies like Bitcoin and Ethereum
    3. Advanced Trading Platforms
      The company provides the popular MetaTrader 5 platform, considered one of the best in the industry. This platform offers advanced tools for technical analysis, automated trading capabilities, and social trading features via ZuluTrade.
    4. High Leverage
      DB Investing offers leverage up to 1:1000, enabling traders to control larger positions with less capital. However, it’s important to be cautious, as leverage increases both risk and potential profit.
    5. Multiple Account Types
      DB Investing offers several account types to meet the needs of different traders:
      STP Account: No commission, spreads starting from 1 pip.
      ECN Account: Suitable for professional traders with spreads starting from 0.0 pips and a commission of $4 per lot.
      PRO Account: Designed for high-volume traders with spreads starting from 0.3 pips and a commission of $1.5 per lot.
      Islamic Account: Available without swap interest for traders who prefer this option.
    6. Comprehensive Educational Support
      DB Investing provides a wide range of educational resources, such as articles, courses, and webinars. Video content is also available to analyze the markets daily and offer valuable tips for traders, both beginners and professionals.
    7. Excellent Customer Support
      The company provides 24/5 customer support through various channels such as email, live chat, and phone. This service ensures traders get the help they need quickly and at any time.
    8. Easy Deposit and Withdrawal
      DB Investing offers multiple payment options, including local and international bank transfers, credit cards, e-wallets like Skrill and Neteller, and cryptocurrencies like USDT. Withdrawals are processed quickly and without fees.

    How to Buy and Sell Currency Pairs
    How to Execute Trades
    Forex trading involves buying one currency while selling another simultaneously. This is done through currency pairs, where the pair shows the value of one currency against another. When you expect the first currency’s value to rise compared to the second, you buy the pair (Going Long). If you expect the first currency’s value to fall, you sell the pair (Going Short).

    Here are the basic steps to execute trades:

    1. Market Analysis
      Before buying or selling, you should analyze the market using technical or fundamental analysis tools. Technical analysis relies on studying charts and patterns, while fundamental analysis focuses on economic news and financial policies.
    2. Open a Trade Position
      After deciding whether to buy or sell based on your market analysis, you can open a trade position through your trading platform, such as MetaTrader 5
      If you expect the first currency to rise against the second, you buy the pair (e.g., buy EUR/USD if you expect the Euro to rise against the US dollar).
      – If you expect the first currency to fall against the second, you sell the pair (e.g., sell GBP/USD if you expect the British Pound to fall against the US dollar).
    3. Determine the Trade Size
      When opening a position, you must decide on the trade size, usually measured in lots. A standard lot is equal to 100,000 units of the base currency, but you can trade smaller sizes like a mini lot (10,000 units) or a micro lot (1,000 units).
    4. Set Stop Loss and Take Profit Orders
      To protect your capital, you should set a stop loss order to define the maximum loss you’re willing to tolerate. Additionally, you can set a take profit order to close the trade when the desired profit is achieved.
    5. Monitor the Market and Manage the Position
      After opening the trade, you will need to monitor the market and manage your positions based on price movements. You can adjust stop loss and take profit orders or even manually close the trade if the market direction changes.
    6. Close the Trade
      When you reach your profit target or wish to limit losses, you can close the trade. When closing the trade, you either sell the currency you bought or buy back the currency you sold, depending on the type of trade.

    Tips for Successful Trades

    • Use Leverage Cautiously: In forex trading, leverage allows you to increase your positions using less capital. However, you should be cautious when using leverage as it amplifies both profits and losses.
    • Constantly Analyze the Market: Whether you follow a fundamental or technical analysis strategy, it’s essential to stay updated on market movements and economic news that may affect currency prices.
    • Stick to a Trading Plan: It’s always recommended to follow a specific trading plan that includes rules for risk management and goal achievement. This reduces the risks from emotional or undisciplined trading.

    Summary
    The process of buying and selling currency pairs depends on making informed decisions based on technical and fundamental analysis. Setting clear goals and effectively managing risks helps in achieving successful trades and generating profits while minimizing potential losses.

    In this second part, we covered how to start forex trading, from the steps to open an account, the features you should look for in a broker, to a detailed explanation of how to buy and sell currency pairs.


    In the third part, we will discuss in more detail the potential risks you may face while trading, as well as the best times to enter the market and seize available opportunities. Stay tuned to continue this comprehensive guide to forex trading.

  • A Comprehensive Guide to Forex Trading

    A Comprehensive Guide to Forex Trading

    Part One

    Introduction
    General Overview of the Forex Market and Its Importance


    The forex market (foreign exchange market) is the largest financial market in the world in terms of daily trading volume. It is characterized by its high liquidity and ease of access, making it one of the most attractive markets for investors and traders globally. The daily trading volume in this market is close to 8 trillion US dollars, providing immense opportunities for profit. However, it also carries high risks that require strong knowledge and prudent risk management.

    Why is Forex Trading Attractive?

    1. High Liquidity: Due to the large number of traders in the market, trades are executed quickly without delays. This liquidity helps reduce the bid-ask spread, which increases the chances of profit.
    2. Flexibility in Trading: The forex market operates 24 hours a day, five days a week, allowing traders the flexibility to enter the market at any time that suits them. This flexibility allows trading outside of regular working hours or even at night, depending on the different time zones.
    3. High Volatility: The high volatility in currency prices is an attractive feature for traders, offering greater opportunities for profit. However, this kind of volatility also increases the risk of loss.
    4. Leverage: Leverage is one of the most important advantages of forex trading, allowing traders to control larger positions than the amount of capital they have. This can amplify profits, but it also increases the potential for losses if caution is not exercised.

    Benefits for Traders

    • High Profit Potential: With tools like leverage, investors can achieve significant profits from even small price movements.
    • Diversity and Opportunities: The forex market offers a wide range of currency pairs to trade, providing varied opportunities for investors.
    • Continuous Learning Opportunities: Forex trading offers ongoing learning opportunities to improve skills, with access to educational resources like books, courses, and analytical articles that help traders refine their strategies.

    What is Forex?
    Understanding the Forex Market
    The forex market is a global market where foreign currencies are traded. The term “Forex” is short for “Foreign Exchange.” In this market, currencies are exchanged for one another based on current exchange rates. The market is decentralized, meaning there is no physical location or centralized exchange for trading, but rather it occurs through a network of global banks and brokerage firms.

    How Does the Forex Market Work?
    Forex works similarly to currency exchange when you travel to another country. When you exchange your local currency for a foreign currency, you are essentially participating in the forex market. If the currency you bought increases in value relative to the one you sold, you make a profit.

    The forex market relies on supply and demand offers made by banks, financial institutions, and traders from around the world. Investors can trade currencies throughout the week from Monday to Friday, excluding weekends (Saturday and Sunday).

    Currency Pairs in the Forex Market
    In the forex market, currencies are traded in pairs, where the value of one currency is compared to the other. Currency pairs are divided into three main categories:

    1. Major Pairs: These pairs contain the US dollar as one of the two currencies and are the most traded. Examples include:
      • EUR/USD: Euro against the US Dollar
      • GBP/USD: British Pound against the US Dollar
    2. Minor Pairs: These pairs do not include the US dollar. Examples include:
      • EUR/GBP: Euro against the British Pound
      • GBP/JPY: British Pound against the Japanese Yen
    3. Exotic Pairs (or Rare Currencies): These consist of emerging market currencies such as the Turkish Lira or the Mexican Peso against major currencies like the US Dollar or Euro. Examples include:
      • USD/TRY: US Dollar against the Turkish Lira
      • EUR/ZAR: Euro against the South African Rand

    Role of Currencies in the Global Economy
    Currencies play a vital role in international trade and investment, as no economic activity can be conducted internationally without using currencies. Exchange rates are determined by multiple economic factors such as:

    • Supply and Demand: When the demand for a currency increases, its value rises, and vice versa.
    • Monetary Policies: Central bank decisions regarding interest rates directly affect a currency’s value.
    • Political and Economic Stability: Countries with political and economic stability attract investors, leading to a rise in their currency’s value.

    Forex Trading: Basic Concepts
    Key Forex Trading Terms
    To trade forex, there are several key terms every trader must understand, as they clarify the processes and strategies used in the market. Below are some important terms:

    1. Price: The price of a currency determined by market supply and demand forces. The price is usually presented in a pair format, such as EUR/USD = 1.1800, meaning one Euro equals 1.1800 US dollars.
    2. Spread: The difference between the bid price and the ask price. The ask price is the price at which a trader can buy the currency, and the bid price is the price at which the trader can sell it. For example, if the ask price for EUR/USD is 1.1805 and the bid price is 1.1803, the spread is 2 pips.
    3. Pip: A pip is the smallest unit of price change in the currency market. Typically, it is the fourth decimal place. For example, if the price of EUR/USD moves from 1.1800 to 1.1801, it has increased by one pip.
    4. Margin: The amount of money a trader needs to deposit as collateral to open a position. It is usually expressed as a percentage of the total trade size. For example, if the broker requires a 1% margin, the trader needs to deposit 1% of the total trade size to open the trade.
    5. Leverage: Leverage is a feature that allows a trader to control a larger position than the amount of capital in their account. For example, if the leverage is 1:100, a trader can open a trade worth $100 for every $1 in their account. While leverage can magnify profits, it also increases the risk of losses.
    6. Long & Short Positions:
      • Long Position: A position where the trader buys a currency expecting its value to rise.
      • Short Position: A position where the trader sells a currency expecting its value to fall.
    7. Fundamental Analysis: This involves evaluating the economic and political situation of a country to predict currency movements. It includes studying factors such as interest rates, inflation, and GDP.
    8. Technical Analysis: This involves studying charts and historical price data to predict future trends. It uses indicators like moving averages, momentum indicators, and more.

    Why These Terms Matter
    Understanding these terms helps traders make better decisions in the market. Traders must be fully aware of how the spread, margin, and leverage affect their trades. Additionally, fundamental and technical analysis are essential tools for analyzing the market and making informed decisions about when to enter or exit a trade.

    How Forex Trading Works
    How Are Currencies Traded?
    Forex trading relies on exchanging currencies in pairs. One currency is bought, and the other is sold at the same time. In other words, when you trade in forex, you are betting on the rise or fall in value of one currency relative to another. For example, if you think the value of the Euro will rise against the US Dollar, you would buy the EUR/USD pair. If the Euro’s value rises as expected, you can sell the pair for a profit.

    Calculating Profits and Losses
    Profits and losses in forex are calculated based on the movement of prices and the number of pips the price moves. The pip, as mentioned earlier, is the smallest possible price change. The size of the profit or loss also depends on the trade size (lot size), which is the unit of measurement for trading in forex.
    For example, if the purchase price of EUR/USD is 1.1800, and it moves to 1.1820 when sold, you have made 20 pips. If the trade size is 1 standard lot (100,000 units of currency), each pip is worth $10, so your profit would be $200.

    Types of Forex Orders
    Several types of orders can be used in forex trading:

    1. Market Orders: Orders that are executed immediately at the current market price.
    2. Limit Orders: Orders that are executed when the price reaches a specific level set by the trader.
    3. Stop Loss Orders: Orders used to set a limit on how much loss a trader can tolerate.
    4. Stop Orders: Similar to stop-loss orders but used to open a new position when the price reaches a certain level.

    Benefits of Using Orders
    Using different types of orders helps traders manage risk better and increase their chances of making profits. Market orders provide quick access to the market, while limit orders and stop-loss orders help ensure that traders do not exceed the losses they are willing to accept.

    In this first part of the comprehensive forex trading guide, we covered the basics of the forex market, how it operates, and how to trade currencies. We discussed how currency pairs work, as well as key trading terms used by traders in this vast market.


    In Part Two, we will delve deeper into the details of the trading process, from how to get started in forex trading to the mechanics of buying and selling currency pairs. We will also explore potential risks and the best times to enter the market. Stay tuned for the continuation of this comprehensive guide to forex trading.

  • The Basics of Elliott Wave Theory

    The Basics of Elliott Wave Theory

    Introduction

    Elliott Wave Theory represents one of the most important tools in technical analysis of financial markets. This theory relies on a recurring pattern of movements that reflect the psychology of investors over time. It is an integral part of understanding how prices move across different markets, whether in forex, stocks, or commodities.

    Ralph Nelson Elliott discovered this theory in the 1930s when he noticed that markets move in specific, predictable patterns based on the psychological changes of market participants. Elliott believed that markets do not move randomly but follow defined patterns that can be read and analysed to predict future price movements.

    The Scientific Basis Behind the Theory

    Elliott Wave Theory is based on the principle that market movements are not random but follow common psychological cycles. According to Elliott, these cycles consist of impulsive waves that move in the direction of the primary trend of the market and corrective waves that move against it.

    Impulsive Waves

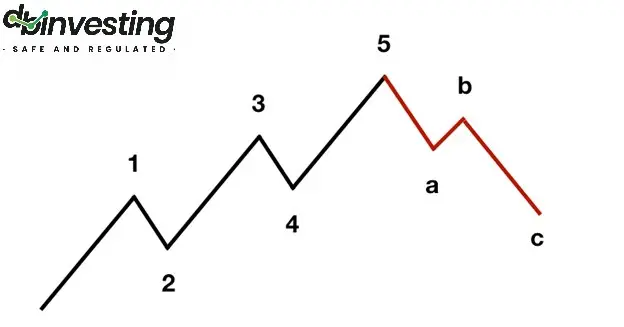
    Impulsive waves represent movements that move in the same direction as the market’s primary trend. These waves consist of five smaller waves, three of which move in the direction of the trend, and two are corrective.

    1. Wave One: This is the beginning of a new trend. This wave usually starts when investors begin buying after a period of market oversold conditions. This wave is often unclear to most investors, as it is considered a part of the correction rather than a new trend.
    2. Wave Two: This is a corrective wave following the first wave. It could be a slight pullback in the market as some investors take profits after the initial movement, but it doesn’t fully reverse the preceding upward movement.
    3. Wave Three: This is the longest and strongest of the waves. At this stage, most investors recognize that the market is in a new upward trend, which drives them to buy heavily, resulting in a significant rise in prices.
    4. Wave Four: This represents another corrective wave after the strong third wave. This wave is usually less severe than the second wave.
    5. Wave Five: This is the final phase of the impulsive movement. It can be weaker than the third wave, but it marks the end of the upward trend before the full correction begins.

    Corrective Waves

    After the impulsive waves end, the market enters a corrective phase consisting of three waves, known as the corrective waves (A-B-C).

    1. Wave A: This is the beginning of the correction after the fifth wave ends. At this stage, investors begin taking profits, leading to a drop in prices.
    2. Wave B: This is an upward retracement within the corrective trend. Some might believe that the market will resume its upward trend, but it is a corrective wave within the correction.
    3. Wave C: This is the final stage of the correction, where the correction is completed, and prices decline further, setting the market up for a new impulsive wave.


    Fractals and Wave Patterns

    One of the distinguishing features of Elliott Wave Theory is the concept of fractals. This refers to the fact that each impulsive and corrective wave consists of smaller waves within it. For example, Wave One could be made up of five smaller waves, with each of those smaller waves following the same structure as the larger waves. This makes the market analysable at multiple time frames, from short periods like minutes to long periods such as years.

    The Relationship Between Elliott Waves and Fibonacci
    Elliott Wave Theory is closely linked to the Fibonacci sequence. The theory uses Fibonacci ratios to predict potential reversal or correction points in the market. For example, ratios like 38.2% and 61.8% can be used to identify key support and resistance levels. Often, corrective waves end at these levels.

    How to Use Fibonacci Ratios with Elliott Waves
    When the market completes an impulsive wave (Waves 1-5), traders can use Fibonacci ratios to determine potential corrective levels for the A-B-C wave. For example, if a trader expects the market to enter a corrective phase, they can draw Fibonacci ratios from the top of Wave Five to the bottom of Wave One to identify possible correction levels.

    Applying Elliott Waves in Trading
    Elliott Waves is a powerful analytical tool that can be used to identify optimal trading opportunities. By understanding the wave movements, traders can pinpoint the best entry and exit points in the market. Here are some examples of how to apply Elliott Waves in trading:

    1. Identifying the Market’s Main Trend
      By analyzing the impulsive and corrective waves, traders can determine whether the market is in an uptrend or downtrend. When the five-wave pattern is completed, a corrective phase can be expected, providing an opportunity for traders to take advantage of the upcoming trend.
    2. Capitalizing on Corrections
      Elliott Waves can be used to forecast potential correction levels. For instance, if a trader expects that the market has completed an impulsive wave, they can use Fibonacci ratios to identify possible correction levels for the A-B-C wave.
    3. Optimal Timing for Entry and Exit
      When the wave pattern is completed, it can serve as a signal for traders to enter or exit the market. For example, if Wave C is completed, it can signal a market entry, as traders expect the market to begin a new impulsive phase.
    4. Combining Elliott Waves with Other Technical Indicators
      The accuracy of Elliott Wave predictions can be enhanced by using them alongside other technical indicators. For example, traders can use moving averages or the Relative Strength Index (RSI) to better identify entry and exit points.

    Practical Examples of Applying Elliott Wave Theory


    Example 1: Trading a Correction After an Uptrend in EUR/USD
    Let’s take an example from the forex market. If you are trading the EUR/USD pair and notice that the price has risen significantly over several weeks, you can analyze this rise using Elliott Waves. The movement can be broken down into five impulsive waves, and once Wave Five is completed, a potential correction phase may begin.
    Once Wave Five is complete, Fibonacci ratios can be used to identify potential correction levels. If the price retraces to the 61.8% level, it may signal that the market has completed its correction and is about to enter a new impulsive wave.

    Example 2: Uptrend in Tesla Stock
    When trading Tesla’s stock, the price may begin an upward movement after a positive earnings announcement. The movement can be broken down into five impulsive waves according to Elliott Waves. Wave One represents the beginning of the new trend after a period of consolidation, and Waves Three and Five continue to push prices higher with strong momentum. During these waves, traders can enter buy positions in each impulsive wave, increasing their chances of profit.

    Challenges of Applying Elliott Wave Theory
    Despite its numerous benefits, traders may face some challenges when applying Elliott Wave Theory:

    • Difficulty in Accurately Identifying Waves
      Identifying waves accurately can be challenging, especially in volatile markets. The market may display confusing patterns, making it difficult to determine which wave the market is currently in.
    • The Need for Extensive Experience
      Elliott Wave Theory requires a substantial amount of knowledge and experience. Traders need to carefully analyze the market and rely on personal judgment, which may lead to differing interpretations among analysts.
    • Relying on Other Tools
      Elliott Wave Theory may not be sufficient on its own. Traders need to combine it with other analytical tools to confirm their predictions and avoid losses.

    Criticisms of Elliott Wave Theory
    Despite its popularity, Elliott Wave Theory has been criticized by some traders and analysts. They argue that the theory can be overly complex and relies on subjective interpretations. Some critics believe that attempts to identify waves may be prone to errors in volatile markets.
    However, many traders still consider this theory a valuable analytical tool that helps them understand market movements and capitalize on trading opportunities.

    Conclusion
    Elliott Wave Theory is a powerful analytical tool that provides a framework for analysing recurring market movements. Although it faces some challenges, when used correctly, it can be extremely useful in analysing financial markets and identifying optimal trading opportunities.

    At DB Investing, we believe that mastering this tool can empower traders to make informed decisions and capitalize on market opportunities. Whether you’re a novice or an experienced trader, incorporating Elliott Waves into your strategy could be the key to unlocking your trading potential.

  • Introduction to Technical Indicators 

    Introduction to Technical Indicators 

    What are Technical Indicators? 

    Technical indicators are essential tools in technical analysis used to help traders make informed trading decisions. When combined with appropriate risk management tools, these indicators allow traders to assess price trends and predict movements in financial markets in the short term. Technical indicators are mathematical calculations based on price data and trading volume, used to identify trends and patterns in price movements. These indicators can show the direction a financial asset is moving during a specific period, helping traders identify the best trading opportunities. 

    At DB Investing, our platform provides traders with access to a wide range of technical indicators, empowering you to make well-informed decisions and take control of your trading strategy. 

    Types of Technical Indicators 

    There are two main types of technical indicators: 

    1. Leading Indicators: These indicators provide signals before the initial price movement, helping traders predict future changes. 
    1. Lagging Indicators: These indicators provide signals after the initial movement and are used to confirm the current trend. 

    Commonly Used Technical Indicators 

    1. Moving Average (MA) 

    The Moving Average is one of the most common lagging technical indicators used to determine the current price trend in the market. It averages the price points of a financial instrument over a specified time frame (such as 15, 20, 30, 50, 100, or 200 periods) and divides them by the number of data points to give a single trend line. The moving average helps confirm the current trend and reduces the effect of random price fluctuations. In most cases, when prices move above the moving average, the current trend is considered upward, while when prices move below the moving average, the current trend is considered downward. 

    There are many different types of moving averages, and some traders use more than one to confirm their signals. This includes simple moving averages and exponential moving averages (which give more weight to recent data). 

    2. Exponential Moving Average (EMA) 

    The Exponential Moving Average is an improved version of the Simple Moving Average (SMA) that gives more weight to the most recent price data, making it more responsive to recent market changes. It is placed as a line on the price chart based on a mathematical formula to smooth out price movements. By assigning more weight to the recent price and less to past prices, the EMA reacts more quickly to recent price changes compared to the simple moving average, which applies equal weight to all movements during the 
    period. To use the EMA, simply go to our MT4 platform and select the Exponential Moving 
    Average from the indicator list. You can also adjust the number of periods to be 
    calculated. Commonly used periods for long-term price tracking are 50, 100, and 200, 
    while 12, 26, and 55 periods are often used for shorter timeframes. 

    3. Moving Average Convergence Divergence (MACD) 

    The Moving Average Convergence Divergence (MACD) is a momentum trend-following indicator that shows the relationship between two moving averages of an asset’s price. The MACD is calculated by subtracting the 26-period EMA from the 12-period EMA. 
     
    MACD = 12-period EMA – 26-period EMA 

     
    The result of this calculation is the MACD line. The nine-day EMA of the MACD is called the “signal line.” It is drawn above the MACD line, serving as a trigger for buy and sell signals. Traders may buy the asset when the MACD crosses above the signal line and sell when the MACD crosses below the signal line. MACD signals can be interpreted in various ways, but the most common methods are crossovers, divergences, and overbought/oversold conditions. 

    4. Relative Strength Index (RSI) 

    The Relative Strength Index (RSI) is a momentum indicator used to evaluate overbought or oversold conditions in the price of an asset. The RSI is displayed as an oscillator that moves between 0 and 100. Values above 70 are considered an indication that the asset is overbought and may be due for a trend reversal, while values below 30 indicate that the asset is oversold and may be undervalued. These levels are known as overbought and oversold lines. 

    The RSI shows a potential buy signal when the RSI crosses above the oversold line (30). A potential sell signal occurs when the RSI crosses below the overbought line (70). 

    With DB Investing’s tools, you can seamlessly integrate the RSI indicator into your analysis to identify market conditions and make well-timed trades. 

    How Are Technical Indicators Used in Trading? 

    Technical indicators can be used in various ways to enhance trading strategies: 

    • Confirming the Trend: The Moving Average and Exponential Moving Average help confirm the current market trend. 
    • Identifying Momentum: The MACD and RSI help identify the strength of momentum and potential reversal signals. 
    • Crossovers: Moving average crossovers and signal line crossovers in the MACD are used to generate buy and sell signals. 

    Conclusion 

    Technical indicators are powerful tools that assist traders in analyzing markets and making informed trading decisions. By understanding how these indicators work and how to apply them correctly, traders can improve their strategies and achieve better results in financial markets. 

    At DB Investing, we offer educational webinars and training courses covering the most important strategies used in financial analysis. You can register for them by clicking here.

     Blog – DB Investing – Dream Big Investing FSA and SCA regulated