Tag: forex

  • A Comprehensive Guide to Forex Trading

    A Comprehensive Guide to Forex Trading

    Part Two

    How to Get Started in Forex Trading

    Steps to Open a Trading Account
    To begin trading in the forex market, traders need to take several essential steps to open a trading account. Here are the steps to follow:

    1. Choose a Suitable Forex Broker
      The first step is selecting a reliable and licensed broker for forex trading. It’s important to choose a broker that provides a secure and transparent trading environment, along with competitive spreads and excellent customer support services.
    2. Register and Open an Account
      After selecting the right broker, you’ll need to register to open an account. You will need to provide personal information such as your name, address, and email, along with submitting proof of identity according to regulatory requirements.
    3. Choose the Type of Account
      Most brokers offer multiple types of accounts (demo accounts and live accounts). A demo account is an excellent option for beginners to practice trading risk-free. Once you feel ready, you can open a live account.
    4. Deposit Funds
      After opening a live account, you will need to deposit the capital you intend to trade with. Most brokers offer several deposit methods such as bank transfers, credit cards, or e-wallets.
    5. Download the Trading Platform
      Most brokers provide online trading platforms or apps that can be downloaded on mobile devices. MetaTrader 5 is the most popular and widely used platform for forex trading.
    6. Start Trading
      Once your account is funded and the trading platform is downloaded, you can start placing buy and sell orders based on the analysis you’ve conducted.

    Advantages of Opening an Account with DB Investing
    DB Investing is one of the prominent brokers in forex trading and Contracts for Difference (CFDs). Here are some advantages that make it an ideal choice for traders:

    1. Regulation and Licensing
      DB Investing is licensed by the Financial Services Authority (FSA) in Seychelles and the Securities and Commodities Authority (SCA) in the UAE, ensuring the company operates within a strict regulatory framework that protects traders’ rights and promotes operational integrity.
    2. Wide Range of Tradable Assets
      DB Investing offers a variety of financial instruments for trading, including:
      Forex currency pairs
      – Precious metals like gold and silver
      – Global indices
      – Commodities like oil and natural gas
      – CFDs on stocks and exchange-traded funds (ETFs)
      – Cryptocurrencies like Bitcoin and Ethereum
    3. Advanced Trading Platforms
      The company provides the popular MetaTrader 5 platform, considered one of the best in the industry. This platform offers advanced tools for technical analysis, automated trading capabilities, and social trading features via ZuluTrade.
    4. High Leverage
      DB Investing offers leverage up to 1:1000, enabling traders to control larger positions with less capital. However, it’s important to be cautious, as leverage increases both risk and potential profit.
    5. Multiple Account Types
      DB Investing offers several account types to meet the needs of different traders:
      STP Account: No commission, spreads starting from 1 pip.
      ECN Account: Suitable for professional traders with spreads starting from 0.0 pips and a commission of $4 per lot.
      PRO Account: Designed for high-volume traders with spreads starting from 0.3 pips and a commission of $1.5 per lot.
      Islamic Account: Available without swap interest for traders who prefer this option.
    6. Comprehensive Educational Support
      DB Investing provides a wide range of educational resources, such as articles, courses, and webinars. Video content is also available to analyze the markets daily and offer valuable tips for traders, both beginners and professionals.
    7. Excellent Customer Support
      The company provides 24/5 customer support through various channels such as email, live chat, and phone. This service ensures traders get the help they need quickly and at any time.
    8. Easy Deposit and Withdrawal
      DB Investing offers multiple payment options, including local and international bank transfers, credit cards, e-wallets like Skrill and Neteller, and cryptocurrencies like USDT. Withdrawals are processed quickly and without fees.

    How to Buy and Sell Currency Pairs
    How to Execute Trades
    Forex trading involves buying one currency while selling another simultaneously. This is done through currency pairs, where the pair shows the value of one currency against another. When you expect the first currency’s value to rise compared to the second, you buy the pair (Going Long). If you expect the first currency’s value to fall, you sell the pair (Going Short).

    Here are the basic steps to execute trades:

    1. Market Analysis
      Before buying or selling, you should analyze the market using technical or fundamental analysis tools. Technical analysis relies on studying charts and patterns, while fundamental analysis focuses on economic news and financial policies.
    2. Open a Trade Position
      After deciding whether to buy or sell based on your market analysis, you can open a trade position through your trading platform, such as MetaTrader 5
      If you expect the first currency to rise against the second, you buy the pair (e.g., buy EUR/USD if you expect the Euro to rise against the US dollar).
      – If you expect the first currency to fall against the second, you sell the pair (e.g., sell GBP/USD if you expect the British Pound to fall against the US dollar).
    3. Determine the Trade Size
      When opening a position, you must decide on the trade size, usually measured in lots. A standard lot is equal to 100,000 units of the base currency, but you can trade smaller sizes like a mini lot (10,000 units) or a micro lot (1,000 units).
    4. Set Stop Loss and Take Profit Orders
      To protect your capital, you should set a stop loss order to define the maximum loss you’re willing to tolerate. Additionally, you can set a take profit order to close the trade when the desired profit is achieved.
    5. Monitor the Market and Manage the Position
      After opening the trade, you will need to monitor the market and manage your positions based on price movements. You can adjust stop loss and take profit orders or even manually close the trade if the market direction changes.
    6. Close the Trade
      When you reach your profit target or wish to limit losses, you can close the trade. When closing the trade, you either sell the currency you bought or buy back the currency you sold, depending on the type of trade.

    Tips for Successful Trades

    • Use Leverage Cautiously: In forex trading, leverage allows you to increase your positions using less capital. However, you should be cautious when using leverage as it amplifies both profits and losses.
    • Constantly Analyze the Market: Whether you follow a fundamental or technical analysis strategy, it’s essential to stay updated on market movements and economic news that may affect currency prices.
    • Stick to a Trading Plan: It’s always recommended to follow a specific trading plan that includes rules for risk management and goal achievement. This reduces the risks from emotional or undisciplined trading.

    Summary
    The process of buying and selling currency pairs depends on making informed decisions based on technical and fundamental analysis. Setting clear goals and effectively managing risks helps in achieving successful trades and generating profits while minimizing potential losses.

    In this second part, we covered how to start forex trading, from the steps to open an account, the features you should look for in a broker, to a detailed explanation of how to buy and sell currency pairs.


    In the third part, we will discuss in more detail the potential risks you may face while trading, as well as the best times to enter the market and seize available opportunities. Stay tuned to continue this comprehensive guide to forex trading.


  • A Comprehensive Guide to Forex Trading

    A Comprehensive Guide to Forex Trading

    Part One

    Introduction
    General Overview of the Forex Market and Its Importance


    The forex market (foreign exchange market) is the largest financial market in the world in terms of daily trading volume. It is characterized by its high liquidity and ease of access, making it one of the most attractive markets for investors and traders globally. The daily trading volume in this market is close to 8 trillion US dollars, providing immense opportunities for profit. However, it also carries high risks that require strong knowledge and prudent risk management.

    Why is Forex Trading Attractive?

    1. High Liquidity: Due to the large number of traders in the market, trades are executed quickly without delays. This liquidity helps reduce the bid-ask spread, which increases the chances of profit.
    2. Flexibility in Trading: The forex market operates 24 hours a day, five days a week, allowing traders the flexibility to enter the market at any time that suits them. This flexibility allows trading outside of regular working hours or even at night, depending on the different time zones.
    3. High Volatility: The high volatility in currency prices is an attractive feature for traders, offering greater opportunities for profit. However, this kind of volatility also increases the risk of loss.
    4. Leverage: Leverage is one of the most important advantages of forex trading, allowing traders to control larger positions than the amount of capital they have. This can amplify profits, but it also increases the potential for losses if caution is not exercised.

    Benefits for Traders

    • High Profit Potential: With tools like leverage, investors can achieve significant profits from even small price movements.
    • Diversity and Opportunities: The forex market offers a wide range of currency pairs to trade, providing varied opportunities for investors.
    • Continuous Learning Opportunities: Forex trading offers ongoing learning opportunities to improve skills, with access to educational resources like books, courses, and analytical articles that help traders refine their strategies.

    What is Forex?
    Understanding the Forex Market
    The forex market is a global market where foreign currencies are traded. The term “Forex” is short for “Foreign Exchange.” In this market, currencies are exchanged for one another based on current exchange rates. The market is decentralized, meaning there is no physical location or centralized exchange for trading, but rather it occurs through a network of global banks and brokerage firms.

    How Does the Forex Market Work?
    Forex works similarly to currency exchange when you travel to another country. When you exchange your local currency for a foreign currency, you are essentially participating in the forex market. If the currency you bought increases in value relative to the one you sold, you make a profit.

    The forex market relies on supply and demand offers made by banks, financial institutions, and traders from around the world. Investors can trade currencies throughout the week from Monday to Friday, excluding weekends (Saturday and Sunday).

    Currency Pairs in the Forex Market
    In the forex market, currencies are traded in pairs, where the value of one currency is compared to the other. Currency pairs are divided into three main categories:

    1. Major Pairs: These pairs contain the US dollar as one of the two currencies and are the most traded. Examples include:
      • EUR/USD: Euro against the US Dollar
      • GBP/USD: British Pound against the US Dollar
    2. Minor Pairs: These pairs do not include the US dollar. Examples include:
      • EUR/GBP: Euro against the British Pound
      • GBP/JPY: British Pound against the Japanese Yen
    3. Exotic Pairs (or Rare Currencies): These consist of emerging market currencies such as the Turkish Lira or the Mexican Peso against major currencies like the US Dollar or Euro. Examples include:
      • USD/TRY: US Dollar against the Turkish Lira
      • EUR/ZAR: Euro against the South African Rand

    Role of Currencies in the Global Economy
    Currencies play a vital role in international trade and investment, as no economic activity can be conducted internationally without using currencies. Exchange rates are determined by multiple economic factors such as:

    • Supply and Demand: When the demand for a currency increases, its value rises, and vice versa.
    • Monetary Policies: Central bank decisions regarding interest rates directly affect a currency’s value.
    • Political and Economic Stability: Countries with political and economic stability attract investors, leading to a rise in their currency’s value.

    Forex Trading: Basic Concepts
    Key Forex Trading Terms
    To trade forex, there are several key terms every trader must understand, as they clarify the processes and strategies used in the market. Below are some important terms:

    1. Price: The price of a currency determined by market supply and demand forces. The price is usually presented in a pair format, such as EUR/USD = 1.1800, meaning one Euro equals 1.1800 US dollars.
    2. Spread: The difference between the bid price and the ask price. The ask price is the price at which a trader can buy the currency, and the bid price is the price at which the trader can sell it. For example, if the ask price for EUR/USD is 1.1805 and the bid price is 1.1803, the spread is 2 pips.
    3. Pip: A pip is the smallest unit of price change in the currency market. Typically, it is the fourth decimal place. For example, if the price of EUR/USD moves from 1.1800 to 1.1801, it has increased by one pip.
    4. Margin: The amount of money a trader needs to deposit as collateral to open a position. It is usually expressed as a percentage of the total trade size. For example, if the broker requires a 1% margin, the trader needs to deposit 1% of the total trade size to open the trade.
    5. Leverage: Leverage is a feature that allows a trader to control a larger position than the amount of capital in their account. For example, if the leverage is 1:100, a trader can open a trade worth $100 for every $1 in their account. While leverage can magnify profits, it also increases the risk of losses.
    6. Long & Short Positions:
      • Long Position: A position where the trader buys a currency expecting its value to rise.
      • Short Position: A position where the trader sells a currency expecting its value to fall.
    7. Fundamental Analysis: This involves evaluating the economic and political situation of a country to predict currency movements. It includes studying factors such as interest rates, inflation, and GDP.
    8. Technical Analysis: This involves studying charts and historical price data to predict future trends. It uses indicators like moving averages, momentum indicators, and more.

    Why These Terms Matter
    Understanding these terms helps traders make better decisions in the market. Traders must be fully aware of how the spread, margin, and leverage affect their trades. Additionally, fundamental and technical analysis are essential tools for analyzing the market and making informed decisions about when to enter or exit a trade.

    How Forex Trading Works
    How Are Currencies Traded?
    Forex trading relies on exchanging currencies in pairs. One currency is bought, and the other is sold at the same time. In other words, when you trade in forex, you are betting on the rise or fall in value of one currency relative to another. For example, if you think the value of the Euro will rise against the US Dollar, you would buy the EUR/USD pair. If the Euro’s value rises as expected, you can sell the pair for a profit.

    Calculating Profits and Losses
    Profits and losses in forex are calculated based on the movement of prices and the number of pips the price moves. The pip, as mentioned earlier, is the smallest possible price change. The size of the profit or loss also depends on the trade size (lot size), which is the unit of measurement for trading in forex.
    For example, if the purchase price of EUR/USD is 1.1800, and it moves to 1.1820 when sold, you have made 20 pips. If the trade size is 1 standard lot (100,000 units of currency), each pip is worth $10, so your profit would be $200.

    Types of Forex Orders
    Several types of orders can be used in forex trading:

    1. Market Orders: Orders that are executed immediately at the current market price.
    2. Limit Orders: Orders that are executed when the price reaches a specific level set by the trader.
    3. Stop Loss Orders: Orders used to set a limit on how much loss a trader can tolerate.
    4. Stop Orders: Similar to stop-loss orders but used to open a new position when the price reaches a certain level.

    Benefits of Using Orders
    Using different types of orders helps traders manage risk better and increase their chances of making profits. Market orders provide quick access to the market, while limit orders and stop-loss orders help ensure that traders do not exceed the losses they are willing to accept.

    In this first part of the comprehensive forex trading guide, we covered the basics of the forex market, how it operates, and how to trade currencies. We discussed how currency pairs work, as well as key trading terms used by traders in this vast market.


    In Part Two, we will delve deeper into the details of the trading process, from how to get started in forex trading to the mechanics of buying and selling currency pairs. We will also explore potential risks and the best times to enter the market. Stay tuned for the continuation of this comprehensive guide to forex trading.

  • DB Investing to Attend SVS Oman 2025! 

    DB Investing to Attend SVS Oman 2025! 

    We are excited to announce that DB Investing, your trusted partner in safe and regulated trading, will be attending the SVS Oman 2025 Expo on February 12–13, 2025, at the JW Marriott Hotel in Muscat, Oman

    Visit us at Booth 10 to discover how we’re revolutionizing the trading experience for investors worldwide!  

    This event brings together industry leaders, innovators, and professionals from around the globe to share insights, explore emerging trends, and build connections that shape the future of financial investments and trading. 

    Why Visit Us at SVS Oman 2025? 

    DB Investing is committed to empowering traders worldwide with cutting-edge tools, secure trading platforms, and unparalleled support. Attending this expo allows us to connect directly with our valued community and showcase our latest advancements in trading and financial solutions. 

    Connecting with us at SVS Oman 2025 will provide you with: 

    • Insights into our platform 
    • Access to exclusive resources for traders 
    • Opportunities to meet our team and get your questions answered 

    Mark your calendars for February 12–13, 2025 and join us at the JW Marriott Hotel in Muscat. Don’t forget to stop by Booth 10 to explore how DB Investing is shaping the future of trading! 

    We can’t wait to see you there!

  • Global Market Trends: Bank of Japan’s Rate Hike, Gold’s Surge, Oil’s Decline, and U.S. Stock Highs

    Global Market Trends: Bank of Japan’s Rate Hike, Gold’s Surge, Oil’s Decline, and U.S. Stock Highs

    Bank of Japan Raises Interest Rates to 0.5% 

    In a landmark decision, the Bank of Japan (BoJ) raised interest rates by 25 basis points, bringing them to 0.5%, the highest level seen since 2008. This marks the third rate increase since the central bank ended its long-standing negative interest rate policy in March 2024. The move signals the BoJ’s commitment to tightening monetary policy as Japan continues to navigate shifting economic conditions. 

    Gold Prices Climb Amid Dollar Pressure and Tariff Uncertainty 

    Gold prices have soared to their highest levels in nearly three months, with the metal heading for its fourth consecutive week of gains. Spot gold saw a rise of 0.7%, reaching $2,773.57 per ounce, translating to a weekly increase of over 2%. 

    The surge in gold prices is largely attributed to growing uncertainty surrounding President Donald Trump’s tariff plans, alongside his persistent calls for interest rate cuts. These factors have exerted downward pressure on the U.S. dollar, further bolstering the appeal of gold as a safe-haven asset in times of economic and political turbulence. 

    Oil Prices Dip Following Trump’s Call for Lower Costs 

    Oil markets experienced a downturn on Friday after President Donald Trump urged OPEC and Saudi Arabia to reduce prices and ramp up crude production. Brent crude futures declined by 50 cents to settle at $77.95 per barrel, while U.S. West Texas Intermediate (WTI) crude dropped by 31 cents to $74.31 per barrel. 

    The President’s comments reflect concerns about elevated energy costs and their potential impact on global economic activity. Market participants are now closely monitoring OPEC’s response to these developments. 

    U.S. Stock Markets Scale New Heights 

    U.S. equities continued their upward momentum, with the S&P 500 index achieving a new record high during Thursday’s trading session on January 23. President Donald Trump’s remarks advocating for lower interest rates and oil prices appear to have bolstered investor sentiment. 

    The S&P 500 gained 0.5%, while the Nasdaq Composite rose by approximately 0.2%. The Dow Jones Industrial Average also surged by 408 points, or 0.9%, marking its fourth consecutive day of gains. These movements highlight the resilience of the U.S. stock market amid mixed global economic signals. 

    Conclusion 

    The global financial landscape is in a state of flux, shaped by significant developments across key markets. The Bank of Japan’s rate hike signals a shift in Japan’s monetary policy approach, while gold’s rise underscores investor caution in the face of economic uncertainty. Meanwhile, oil’s decline reflects ongoing geopolitical pressures, and U.S. stocks continue to demonstrate impressive growth. As these trends unfold, market participants must stay attuned to policy changes and global economic shifts to navigate the complexities of the current environment effectively. 

  • The Basics of Elliott Wave Theory

    The Basics of Elliott Wave Theory

    Introduction

    Elliott Wave Theory represents one of the most important tools in technical analysis of financial markets. This theory relies on a recurring pattern of movements that reflect the psychology of investors over time. It is an integral part of understanding how prices move across different markets, whether in forex, stocks, or commodities.

    Ralph Nelson Elliott discovered this theory in the 1930s when he noticed that markets move in specific, predictable patterns based on the psychological changes of market participants. Elliott believed that markets do not move randomly but follow defined patterns that can be read and analysed to predict future price movements.

    The Scientific Basis Behind the Theory

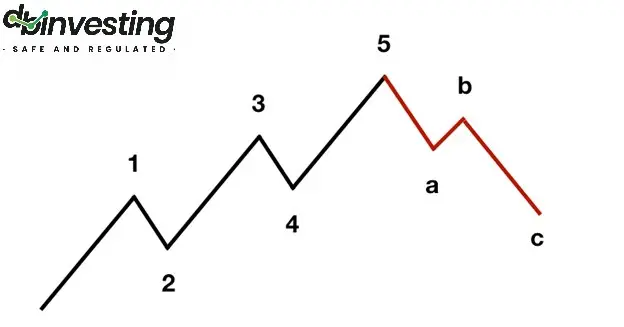
    Elliott Wave Theory is based on the principle that market movements are not random but follow common psychological cycles. According to Elliott, these cycles consist of impulsive waves that move in the direction of the primary trend of the market and corrective waves that move against it.

    Impulsive Waves

    Impulsive waves represent movements that move in the same direction as the market’s primary trend. These waves consist of five smaller waves, three of which move in the direction of the trend, and two are corrective.

    1. Wave One: This is the beginning of a new trend. This wave usually starts when investors begin buying after a period of market oversold conditions. This wave is often unclear to most investors, as it is considered a part of the correction rather than a new trend.
    2. Wave Two: This is a corrective wave following the first wave. It could be a slight pullback in the market as some investors take profits after the initial movement, but it doesn’t fully reverse the preceding upward movement.
    3. Wave Three: This is the longest and strongest of the waves. At this stage, most investors recognize that the market is in a new upward trend, which drives them to buy heavily, resulting in a significant rise in prices.
    4. Wave Four: This represents another corrective wave after the strong third wave. This wave is usually less severe than the second wave.
    5. Wave Five: This is the final phase of the impulsive movement. It can be weaker than the third wave, but it marks the end of the upward trend before the full correction begins.

    Corrective Waves

    After the impulsive waves end, the market enters a corrective phase consisting of three waves, known as the corrective waves (A-B-C).

    1. Wave A: This is the beginning of the correction after the fifth wave ends. At this stage, investors begin taking profits, leading to a drop in prices.
    2. Wave B: This is an upward retracement within the corrective trend. Some might believe that the market will resume its upward trend, but it is a corrective wave within the correction.
    3. Wave C: This is the final stage of the correction, where the correction is completed, and prices decline further, setting the market up for a new impulsive wave.


    Fractals and Wave Patterns

    One of the distinguishing features of Elliott Wave Theory is the concept of fractals. This refers to the fact that each impulsive and corrective wave consists of smaller waves within it. For example, Wave One could be made up of five smaller waves, with each of those smaller waves following the same structure as the larger waves. This makes the market analysable at multiple time frames, from short periods like minutes to long periods such as years.

    The Relationship Between Elliott Waves and Fibonacci
    Elliott Wave Theory is closely linked to the Fibonacci sequence. The theory uses Fibonacci ratios to predict potential reversal or correction points in the market. For example, ratios like 38.2% and 61.8% can be used to identify key support and resistance levels. Often, corrective waves end at these levels.

    How to Use Fibonacci Ratios with Elliott Waves
    When the market completes an impulsive wave (Waves 1-5), traders can use Fibonacci ratios to determine potential corrective levels for the A-B-C wave. For example, if a trader expects the market to enter a corrective phase, they can draw Fibonacci ratios from the top of Wave Five to the bottom of Wave One to identify possible correction levels.

    Applying Elliott Waves in Trading
    Elliott Waves is a powerful analytical tool that can be used to identify optimal trading opportunities. By understanding the wave movements, traders can pinpoint the best entry and exit points in the market. Here are some examples of how to apply Elliott Waves in trading:

    1. Identifying the Market’s Main Trend
      By analyzing the impulsive and corrective waves, traders can determine whether the market is in an uptrend or downtrend. When the five-wave pattern is completed, a corrective phase can be expected, providing an opportunity for traders to take advantage of the upcoming trend.
    2. Capitalizing on Corrections
      Elliott Waves can be used to forecast potential correction levels. For instance, if a trader expects that the market has completed an impulsive wave, they can use Fibonacci ratios to identify possible correction levels for the A-B-C wave.
    3. Optimal Timing for Entry and Exit
      When the wave pattern is completed, it can serve as a signal for traders to enter or exit the market. For example, if Wave C is completed, it can signal a market entry, as traders expect the market to begin a new impulsive phase.
    4. Combining Elliott Waves with Other Technical Indicators
      The accuracy of Elliott Wave predictions can be enhanced by using them alongside other technical indicators. For example, traders can use moving averages or the Relative Strength Index (RSI) to better identify entry and exit points.

    Practical Examples of Applying Elliott Wave Theory


    Example 1: Trading a Correction After an Uptrend in EUR/USD
    Let’s take an example from the forex market. If you are trading the EUR/USD pair and notice that the price has risen significantly over several weeks, you can analyze this rise using Elliott Waves. The movement can be broken down into five impulsive waves, and once Wave Five is completed, a potential correction phase may begin.
    Once Wave Five is complete, Fibonacci ratios can be used to identify potential correction levels. If the price retraces to the 61.8% level, it may signal that the market has completed its correction and is about to enter a new impulsive wave.

    Example 2: Uptrend in Tesla Stock
    When trading Tesla’s stock, the price may begin an upward movement after a positive earnings announcement. The movement can be broken down into five impulsive waves according to Elliott Waves. Wave One represents the beginning of the new trend after a period of consolidation, and Waves Three and Five continue to push prices higher with strong momentum. During these waves, traders can enter buy positions in each impulsive wave, increasing their chances of profit.

    Challenges of Applying Elliott Wave Theory
    Despite its numerous benefits, traders may face some challenges when applying Elliott Wave Theory:

    • Difficulty in Accurately Identifying Waves
      Identifying waves accurately can be challenging, especially in volatile markets. The market may display confusing patterns, making it difficult to determine which wave the market is currently in.
    • The Need for Extensive Experience
      Elliott Wave Theory requires a substantial amount of knowledge and experience. Traders need to carefully analyze the market and rely on personal judgment, which may lead to differing interpretations among analysts.
    • Relying on Other Tools
      Elliott Wave Theory may not be sufficient on its own. Traders need to combine it with other analytical tools to confirm their predictions and avoid losses.

    Criticisms of Elliott Wave Theory
    Despite its popularity, Elliott Wave Theory has been criticized by some traders and analysts. They argue that the theory can be overly complex and relies on subjective interpretations. Some critics believe that attempts to identify waves may be prone to errors in volatile markets.
    However, many traders still consider this theory a valuable analytical tool that helps them understand market movements and capitalize on trading opportunities.

    Conclusion
    Elliott Wave Theory is a powerful analytical tool that provides a framework for analysing recurring market movements. Although it faces some challenges, when used correctly, it can be extremely useful in analysing financial markets and identifying optimal trading opportunities.

    At DB Investing, we believe that mastering this tool can empower traders to make informed decisions and capitalize on market opportunities. Whether you’re a novice or an experienced trader, incorporating Elliott Waves into your strategy could be the key to unlocking your trading potential.