Tag: financial markets

  • DB Investing Wins Best IB/Affiliate Programme at Money Expo India 2025

    DB Investing Wins Best IB/Affiliate Programme at Money Expo India 2025

    Success in the financial markets is built on trust, innovation, and strong partnerships. At DB Investing, we are proud to announce that our efforts in these areas have been recognized: we have been awarded Best IB/Affiliate Programme at Money Expo India 2025, one of the region’s most influential financial gatherings. 

    A Platform for Innovation and Growth 
    Held at the Jio World Convention Centre in Mumbai, Money Expo India 2025 brought together brokers, fintech innovators, investors, and industry leaders. Our Booth 13 served as a hub for meaningful discussions around growth, innovation, and the future of trading. 

    The highlight of our participation was receiving the Best IB/Affiliate Programme award. This recognition celebrates the strength of our program, which is designed to support partners through: 

    • Competitive, transparent commission structures. 
    • Dedicated support and relationship management. 
    • An expanding ecosystem of trading tools and resources. 

    Our Commitment to the Future 
    This award is not the finish line. It reinforces our drive to continue investing in technology, partnerships, and platforms that make trading more accessible and efficient for our community. The DB Social trading app and our suite of services reflect our vision to simplify investing and help traders and affiliates succeed in dynamic markets. 

    To our clients, affiliates, and partners – thank you for your trust. This achievement belongs to all of us. 

    Trade with an award-winning broker today: www.dbinvesting.com 

    📱 Download the DB Social trading app: 

  • Tips from Leading Investors

    Tips from Leading Investors

    Part 3: George Soros

    Who is George Soros?
    George Soros is one of the greatest and most controversial investors in the world. He is known as “the man who broke the Bank of England” after making huge profits by speculating against the British pound during the 1992 currency crisis.

    Born in Hungary in 1930, Soros emigrated to Britain after World War II, where he studied philosophy at the London School of Economics. His financial career began when he joined the banking sector, later founding the Soros Fund, which eventually became the Quantum Fund, one of the most successful hedge funds in history.

    Soros blends his economic knowledge with a deep understanding of human behavior, making him a unique investor with the ability to make bold decisions even in the toughest circumstances.

    George Soros’ Wealth
    Soros’ net worth is currently estimated at around $8.6 billion, according to Forbes. Over the course of his investment career, Soros has achieved stunning profits through his analytical and daring strategies, particularly in currency and emerging markets. One of his most notable financial achievements was making a billion-dollar profit in a single day after his big bet against the British pound.

    But Soros is not just an investor; he is also a prominent philanthropist who has donated over $32 billion of his fortune to support education, human rights, and freedom of expression through his Open Society Foundations.

    Key Investment and Financial Success Tips from George Soros
    George Soros is known for his investment acumen, his boldness in decision-making, and his ability to read markets in a unique way. Here are some of his key tips:

    1. Know When You’re Wrong and Learn from It
      Soros says, “I am rich because I know when I am wrong.” One of Soros’ key skills is his ability to quickly admit when he is wrong and to correct it before the losses escalate. This advice emphasizes that flexibility and the ability to adjust strategies based on changing circumstances are key to success in investing.
    2. Take Advantage of Imbalances in the Markets
      Soros believes that markets are not always rational, and that bubbles and crises create opportunities for savvy investors. He says, “Markets tend to be wrong frequently, and you have to take advantage of those mistakes.” His deep understanding of this principle allowed him to make huge profits by speculating on currencies and stocks.
    3. Be Bold in Decision-Making
      Soros has always been bold in his investment bets and stresses the importance of confidence when making major decisions. His famous quote, “You don’t have to be right all the time, but when you’re right, make it count,” summarizes his philosophy of investing large amounts when he is confident in his analysis.
    4. Understand the Relationship Between Economics and Human Behavior
      One of the pillars of Soros’ philosophy is his deep understanding of human behavior and its impact on markets. He says, “Markets are driven by expectations and illusions, not just facts.” This understanding allowed him to predict market movements and profit from its fluctuations.
    5. Focus on Risk Management
      Soros always emphasizes the importance of protecting capital. His advice is: “Surviving is more important than making money.” He sees risk management as the foundation of success in investing, even if that means missing out on certain opportunities.

    George Soros is not just an ordinary investor; he is a model of boldness, intelligence, and the ability to turn crises into opportunities.


    Following his advice, such as accepting mistakes, seizing opportunities, and focusing on risk management, can help you improve your investment strategies.

    Learn from the markets and from yourself and be ready to make decisions when the opportunity arises” – this is Soros’ philosophy that led him to success.

    2. Take Advantage of Imbalances in the Markets

    Soros believes that markets are not always rational, and that bubbles and crises

    create opportunities for savvy investors. He says, “Markets tend to be wrong

    frequently, and you have to take advantage of those mistakes.” His deep

    understanding of this principle allowed him to make huge profits by speculating

    on currencies and stocks.

    3. Be Bold in Decision-Making

    Soros has always been bold in his investment bets and stresses the importance

    of confidence when making major decisions. His famous quote, “You don’t have

    to be right all the time, but when you’re right, make it count,” summarizes his

    philosophy of investing large amounts when he is confident in his analysis.

    4. Understand the Relationship Between Economics and Human Behavior

    One of the pillars of Soros’ philosophy is his deep understanding of human

    behavior and its impact on markets. He says, “Markets are driven by

    expectations and illusions, not just facts.” This understanding allowed him to

    predict market movements and profit from its fluctuations.

    5. Focus on Risk Management

    Soros always emphasizes the importance of protecting capital. His advice is:

    “Surviving is more important than making money.” He sees risk management as

    the foundation of success in investing, even if that means missing out on certain

    opportunities.

    George Soros is not just an ordinary investor; he is a model of boldness, intelligence,

    and the ability to turn crises into opportunities.

    Following his advice, such as accepting mistakes, seizing opportunities, and focusing

    on risk management, can help you improve your investment strategies.

    “Learn from the markets and from yourself and be ready to make decisions when

    the opportunity arises” – this is Soros’ philosophy that led him to success

  • Transform Your Trading with the AI-Powered Signal Centre Tool

    Transform Your Trading with the AI-Powered Signal Centre Tool

    At DB Investing, we understand that making informed decisions is key to success in trading. That’s why we’ve integrated a powerful new feature into our platform: the Signal Centre Tool. This AI-powered tool provides traders with real-time, data-driven signals that can help guide smarter trading choices and enhance overall strategies. 

    Why Use the Signal Centre Tool? 

    With the dynamic nature of the financial markets, having a reliable resource to inform your trading decisions is crucial. The Signal Centre Tool allows you to access real-time, high-quality trading signals that are personalized to suit your specific needs. Here’s what makes it stand out: 

    • AI-Powered Signals: The tool generates signals using cutting-edge AI algorithms, ensuring accuracy and reliability in every signal. 
    • Real-Time Insights: Get up-to-date information and react quickly to market changes. 
    • Risk Management: Minimize your risks with advanced strategies and alerts tailored to your trading style. 
    • Easy Access: Seamlessly integrate the Signal Centre Tool into your existing DB Investing platform for instant results. 

    How Can the Signal Centre Tool Help You? 

    Whether you are an expert trader or just starting, the Signal Centre Tool is an invaluable asset to your trading toolkit. Its AI-generated signals give you a competitive edge by providing timely, actionable advice for every trade you make. 

    Get Started by Simply logging into your account and exploring this exciting feature today: https://dbinvesting.com/en/signal-centre-tool/ 

  • The Basics of Elliott Wave Theory

    The Basics of Elliott Wave Theory

    Introduction

    Elliott Wave Theory represents one of the most important tools in technical analysis of financial markets. This theory relies on a recurring pattern of movements that reflect the psychology of investors over time. It is an integral part of understanding how prices move across different markets, whether in forex, stocks, or commodities.

    Ralph Nelson Elliott discovered this theory in the 1930s when he noticed that markets move in specific, predictable patterns based on the psychological changes of market participants. Elliott believed that markets do not move randomly but follow defined patterns that can be read and analysed to predict future price movements.

    The Scientific Basis Behind the Theory

    Elliott Wave Theory is based on the principle that market movements are not random but follow common psychological cycles. According to Elliott, these cycles consist of impulsive waves that move in the direction of the primary trend of the market and corrective waves that move against it.

    Impulsive Waves

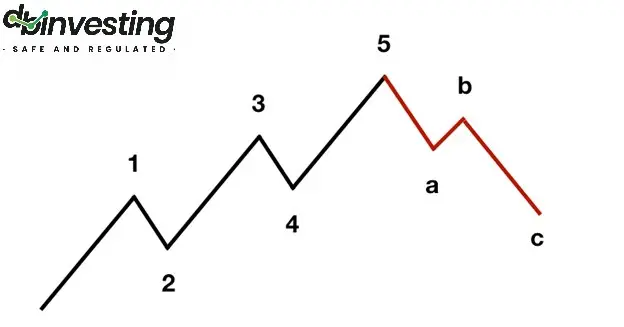
    Impulsive waves represent movements that move in the same direction as the market’s primary trend. These waves consist of five smaller waves, three of which move in the direction of the trend, and two are corrective.

    1. Wave One: This is the beginning of a new trend. This wave usually starts when investors begin buying after a period of market oversold conditions. This wave is often unclear to most investors, as it is considered a part of the correction rather than a new trend.
    2. Wave Two: This is a corrective wave following the first wave. It could be a slight pullback in the market as some investors take profits after the initial movement, but it doesn’t fully reverse the preceding upward movement.
    3. Wave Three: This is the longest and strongest of the waves. At this stage, most investors recognize that the market is in a new upward trend, which drives them to buy heavily, resulting in a significant rise in prices.
    4. Wave Four: This represents another corrective wave after the strong third wave. This wave is usually less severe than the second wave.
    5. Wave Five: This is the final phase of the impulsive movement. It can be weaker than the third wave, but it marks the end of the upward trend before the full correction begins.

    Corrective Waves

    After the impulsive waves end, the market enters a corrective phase consisting of three waves, known as the corrective waves (A-B-C).

    1. Wave A: This is the beginning of the correction after the fifth wave ends. At this stage, investors begin taking profits, leading to a drop in prices.
    2. Wave B: This is an upward retracement within the corrective trend. Some might believe that the market will resume its upward trend, but it is a corrective wave within the correction.
    3. Wave C: This is the final stage of the correction, where the correction is completed, and prices decline further, setting the market up for a new impulsive wave.


    Fractals and Wave Patterns

    One of the distinguishing features of Elliott Wave Theory is the concept of fractals. This refers to the fact that each impulsive and corrective wave consists of smaller waves within it. For example, Wave One could be made up of five smaller waves, with each of those smaller waves following the same structure as the larger waves. This makes the market analysable at multiple time frames, from short periods like minutes to long periods such as years.

    The Relationship Between Elliott Waves and Fibonacci
    Elliott Wave Theory is closely linked to the Fibonacci sequence. The theory uses Fibonacci ratios to predict potential reversal or correction points in the market. For example, ratios like 38.2% and 61.8% can be used to identify key support and resistance levels. Often, corrective waves end at these levels.

    How to Use Fibonacci Ratios with Elliott Waves
    When the market completes an impulsive wave (Waves 1-5), traders can use Fibonacci ratios to determine potential corrective levels for the A-B-C wave. For example, if a trader expects the market to enter a corrective phase, they can draw Fibonacci ratios from the top of Wave Five to the bottom of Wave One to identify possible correction levels.

    Applying Elliott Waves in Trading
    Elliott Waves is a powerful analytical tool that can be used to identify optimal trading opportunities. By understanding the wave movements, traders can pinpoint the best entry and exit points in the market. Here are some examples of how to apply Elliott Waves in trading:

    1. Identifying the Market’s Main Trend
      By analyzing the impulsive and corrective waves, traders can determine whether the market is in an uptrend or downtrend. When the five-wave pattern is completed, a corrective phase can be expected, providing an opportunity for traders to take advantage of the upcoming trend.
    2. Capitalizing on Corrections
      Elliott Waves can be used to forecast potential correction levels. For instance, if a trader expects that the market has completed an impulsive wave, they can use Fibonacci ratios to identify possible correction levels for the A-B-C wave.
    3. Optimal Timing for Entry and Exit
      When the wave pattern is completed, it can serve as a signal for traders to enter or exit the market. For example, if Wave C is completed, it can signal a market entry, as traders expect the market to begin a new impulsive phase.
    4. Combining Elliott Waves with Other Technical Indicators
      The accuracy of Elliott Wave predictions can be enhanced by using them alongside other technical indicators. For example, traders can use moving averages or the Relative Strength Index (RSI) to better identify entry and exit points.

    Practical Examples of Applying Elliott Wave Theory


    Example 1: Trading a Correction After an Uptrend in EUR/USD
    Let’s take an example from the forex market. If you are trading the EUR/USD pair and notice that the price has risen significantly over several weeks, you can analyze this rise using Elliott Waves. The movement can be broken down into five impulsive waves, and once Wave Five is completed, a potential correction phase may begin.
    Once Wave Five is complete, Fibonacci ratios can be used to identify potential correction levels. If the price retraces to the 61.8% level, it may signal that the market has completed its correction and is about to enter a new impulsive wave.

    Example 2: Uptrend in Tesla Stock
    When trading Tesla’s stock, the price may begin an upward movement after a positive earnings announcement. The movement can be broken down into five impulsive waves according to Elliott Waves. Wave One represents the beginning of the new trend after a period of consolidation, and Waves Three and Five continue to push prices higher with strong momentum. During these waves, traders can enter buy positions in each impulsive wave, increasing their chances of profit.

    Challenges of Applying Elliott Wave Theory
    Despite its numerous benefits, traders may face some challenges when applying Elliott Wave Theory:

    • Difficulty in Accurately Identifying Waves
      Identifying waves accurately can be challenging, especially in volatile markets. The market may display confusing patterns, making it difficult to determine which wave the market is currently in.
    • The Need for Extensive Experience
      Elliott Wave Theory requires a substantial amount of knowledge and experience. Traders need to carefully analyze the market and rely on personal judgment, which may lead to differing interpretations among analysts.
    • Relying on Other Tools
      Elliott Wave Theory may not be sufficient on its own. Traders need to combine it with other analytical tools to confirm their predictions and avoid losses.

    Criticisms of Elliott Wave Theory
    Despite its popularity, Elliott Wave Theory has been criticized by some traders and analysts. They argue that the theory can be overly complex and relies on subjective interpretations. Some critics believe that attempts to identify waves may be prone to errors in volatile markets.
    However, many traders still consider this theory a valuable analytical tool that helps them understand market movements and capitalize on trading opportunities.

    Conclusion
    Elliott Wave Theory is a powerful analytical tool that provides a framework for analysing recurring market movements. Although it faces some challenges, when used correctly, it can be extremely useful in analysing financial markets and identifying optimal trading opportunities.

    At DB Investing, we believe that mastering this tool can empower traders to make informed decisions and capitalize on market opportunities. Whether you’re a novice or an experienced trader, incorporating Elliott Waves into your strategy could be the key to unlocking your trading potential.

  • Analysis of Fibonacci Levels and Their Use in Financial Trading

    Analysis of Fibonacci Levels and Their Use in Financial Trading

    Introduction

    At DB Investing, empowering traders with effective tools and strategies is at the core of what we do. Among these tools, Fibonacci levels stand out as a widely used method to identify potential support and resistance areas in the financial markets. Named after the Italian mathematician Leonardo Fibonacci, these levels are horizontal lines derived from Fibonacci percentages—23.6%, 38.2%, 61.8%, and 78.6%. The commonly used 50% ratio, though not a Fibonacci number, is also considered an essential reference for traders.

    Importance of Fibonacci Levels

    Fibonacci levels offer a method to analyze market movements by connecting two significant price points, such as the highest and lowest prices, and drawing retracement levels between them. At DB Investing, we believe traders can enhance their strategies by mastering these levels to forecast potential market reversals and continuations.

    The General Formula for Fibonacci Levels and How to Calculate Them

    Fibonacci retracement levels are calculated using the Fibonacci sequence, which follows a specific formula. The sequence starts with 0 and 1, and each subsequent number is the sum of the two preceding ones:

    • F(0) = 0
    • F(1) = 1
    • F(n) = F(n-1) + F(n-2) for n > 1

    Where:

    • F(n) is the number that appears at the nth position in the Fibonacci sequence.
    • F(0) equals 0.
    • F(1) equals 1.
    • F(n) is calculated by adding the previous two numbers to obtain the next number in the sequence (F(n-1) + F(n-2)).

    Fibonacci Sequence Overview:

    • F(0) = 0
    • F(1) = 1
    • F(2) = F(1) + F(0) = 1 + 0 = 1
    • F(3) = F(2) + F(1) = 1 + 1 = 2
    • F(4) = F(3) + F(2) = 2 + 1 = 3
    • F(5) = F(4) + F(3) = 3 + 2 = 5

    Thus, each number is the sum of the two preceding numbers: 0, 1, 1, 2, 3, 5, 8, 13, 21, 34, 55, 89, 144, 233, 377, 610, and so on. This series continues infinitely, and any number in the sequence can be calculated by adding the two previous numbers.

    Insights from Fibonacci Levels

    At first glance, everything in this sequence appears natural. However, there is a fascinating relationship discovered in the connection between consecutive numbers. This relationship is observed not only in the Fibonacci sequence but also in various aspects of human life, nature, and even the smallest parts of the human body, such as chromosomes.

    The Fascinating Relationship in the Sequence

    It is worth noting that the results of the mathematical process in the relationship between numbers in any arithmetic sequence will always yield the same result, no matter how the sequence is formulated. This relationship has been found in numerous other phenomena related to human life, aesthetics, and even in the smallest parts of the human body, like chromosomes, which humans rely on for their natural functions. This relationship has also been observed in the largest galaxies in the universe and throughout nature.

    The mathematical operation involves dividing a number by the one that precedes or follows it, as follows: 0, 1, 1, 2, 3, 5, 8, 13, 21, 34, 55, 89, 144, 233, 377, 610…

    • Dividing any number by the next one results in approximately 0.618.
      • 610 / 377 = 1.618
      • 233 / 144 = 1.618
      • 89 / 55 = 1.618
    • Dividing the previous number by the current one results in approximately 1.618.
      • 377 / 610 = 61.8
      • 144 / 233 = 61.8
      • 55 / 89 = 61.8

    Excess Fibonacci Levels

    What if we reverse the mathematical operation so that the previous number is divided by the next one: 0, 1, 1, 2, 3, 5, 8, 13, 21, 34, 55, 89, 144, 233, 377, 610…

    • 377 / 610 = 61.8
    • 233 / 144 = 61.8
    • 144 / 233 = 61.8

    By reversing the operation, we still get a constant value of 61.8.

    What if we divide a number by a number two positions before it in the sequence?

    • 610 / 233 = 2.618
    • 144 / 55 = 2.618
    • 89 / 34 = 2.618

    We see the number has changed from 1.618 to 2.618, where the difference between 1 and 2 represents the difference in the numbers being divided. If we reverse the division, the result is 38.2.

    If we divide a number by one with a two-step difference, the result is 4.236:

    • 610 / 144 = 4.236
    • 233 / 55 = 4.236

    Reversing the division gives 0.236:

    • 144 / 610 = 0.236
    • 55 / 233 = 0.236

    Conclusions

    From the above, we can conclude that dividing any arithmetic sequence by itself yields constant results that never change, and these results are considered laws and constants.

    The Relationship in the Market

    These constants can be seen everywhere, as mentioned earlier. But the question is: what do they represent in the market, and how can they be useful?

    It is known that market patterns and events depend on two factors: time and price movement, which form patterns. These movements are always constant and not random, and their outputs are predictable. Therefore, Fibonacci numbers are used for their stability in mathematical outputs, as explained earlier. But what does each number mean?

    Before explaining further, we must reference the relationship in the mathematical operations for the results of the numbers: 423.6, 261.8, 161.8, 61.8, 38.2, 23.6

    If we divide these numbers by each other, we get the same results as in the previous operations:

    • 23.6 / 38.2 = 0.618
    • 38.2 / 23.6 = 1.618
    • 423.6 / 261.8 = 1.618
    • 38.2 / 23.6 = 1.618

    We observe that the results of the mathematical operations in the sequence are also equal to the initial outputs. This consistency is based on the previous mathematical principle and demonstrates the stability in the results of arithmetic sequences, or what is referred to as the golden ratio 61.8 and 161.8.

    The Golden Ratio

    What do the golden ratios 61.8 and 161.8 represent? As demonstrated, 61.8 is the result of two consecutive numbers in the arithmetic sequence, and 161.8 is the reverse of the same process. These are identical outcomes from dividing the results of these operations. If we consider a specific price movement between 0% and 100%, the constant ratios in the sequence are 23.6%, 38.2%, and 61.8%, all within the complete movement from 0% to 100%. However, the numbers 161.8%, 261.8%, and 423.6% are outside the full range represented by 0% to 100%, and are therefore called price extension numbers.

    Thus, the numbers 161.8, 261.8, and 423.6 represent extension levels, where the price is expected to reach if it breaks out of a certain price movement range beyond the 0% to 100% range.

    Setting and Installing Fibonacci Levels

    There are various types of Fibonacci levels that can be used, such as Fibonacci Channels, Fans, and others, but it is recommended to use Fibonacci Retracement levels. These levels are drawn by connecting the highest and lowest points (the highest and lowest price points) within a certain period, and they represent key support and resistance areas.

    Installing the Tool on MetaTrader 4

    You can install and draw this tool on MetaTrader 4 or 5 using one of two methods:

    1. Find the “Draw Fibonacci Retracement” option in the top toolbar of the platform.
    2. From the Insert menu in the top bar of the platform, you will find the Fibonacci option, then select Retracement.

    Advantages and Disadvantages of Using Fibonacci Levels in Trading

    Advantages

    • Helps identify potential support and resistance areas in the market.
    • Provides important time ratios for price movement projections and potential extension and retracement periods.
    • Increases traders’ confidence when a potential price reversal aligns with key Fibonacci levels.
    • Both beginners and professional traders can benefit from Fibonacci levels.

    Disadvantages

    • Some traders may initially find it difficult to correctly understand and apply Fibonacci levels.
    • Relies on historical price analysis and may not always be accurate, especially during rapid market changes.
    • Requires additional indicators to confirm the validity of signals.

    Conclusion

    At DB Investing, we view Fibonacci levels as a powerful tool for traders aiming to refine their strategies. Success with Fibonacci levels hinges on combining technical knowledge with comprehensive market analysis. By leveraging these insights, traders can navigate financial markets with increased confidence and precision. The effectiveness of using Fibonacci levels depends on the trader’s skills and experience and their ability to analyse the market comprehensively. Fibonacci levels should be viewed as an additional tool in the decision-making process, not as a substitute for relying on thorough research and market analysis

  • Introduction to Technical Indicators 

    Introduction to Technical Indicators 

    What are Technical Indicators? 

    Technical indicators are essential tools in technical analysis used to help traders make informed trading decisions. When combined with appropriate risk management tools, these indicators allow traders to assess price trends and predict movements in financial markets in the short term. Technical indicators are mathematical calculations based on price data and trading volume, used to identify trends and patterns in price movements. These indicators can show the direction a financial asset is moving during a specific period, helping traders identify the best trading opportunities. 

    At DB Investing, our platform provides traders with access to a wide range of technical indicators, empowering you to make well-informed decisions and take control of your trading strategy. 

    Types of Technical Indicators 

    There are two main types of technical indicators: 

    1. Leading Indicators: These indicators provide signals before the initial price movement, helping traders predict future changes. 
    1. Lagging Indicators: These indicators provide signals after the initial movement and are used to confirm the current trend. 

    Commonly Used Technical Indicators 

    1. Moving Average (MA) 

    The Moving Average is one of the most common lagging technical indicators used to determine the current price trend in the market. It averages the price points of a financial instrument over a specified time frame (such as 15, 20, 30, 50, 100, or 200 periods) and divides them by the number of data points to give a single trend line. The moving average helps confirm the current trend and reduces the effect of random price fluctuations. In most cases, when prices move above the moving average, the current trend is considered upward, while when prices move below the moving average, the current trend is considered downward. 

    There are many different types of moving averages, and some traders use more than one to confirm their signals. This includes simple moving averages and exponential moving averages (which give more weight to recent data). 

    2. Exponential Moving Average (EMA) 

    The Exponential Moving Average is an improved version of the Simple Moving Average (SMA) that gives more weight to the most recent price data, making it more responsive to recent market changes. It is placed as a line on the price chart based on a mathematical formula to smooth out price movements. By assigning more weight to the recent price and less to past prices, the EMA reacts more quickly to recent price changes compared to the simple moving average, which applies equal weight to all movements during the 
    period. To use the EMA, simply go to our MT4 platform and select the Exponential Moving 
    Average from the indicator list. You can also adjust the number of periods to be 
    calculated. Commonly used periods for long-term price tracking are 50, 100, and 200, 
    while 12, 26, and 55 periods are often used for shorter timeframes. 

    3. Moving Average Convergence Divergence (MACD) 

    The Moving Average Convergence Divergence (MACD) is a momentum trend-following indicator that shows the relationship between two moving averages of an asset’s price. The MACD is calculated by subtracting the 26-period EMA from the 12-period EMA. 
     
    MACD = 12-period EMA – 26-period EMA 

     
    The result of this calculation is the MACD line. The nine-day EMA of the MACD is called the “signal line.” It is drawn above the MACD line, serving as a trigger for buy and sell signals. Traders may buy the asset when the MACD crosses above the signal line and sell when the MACD crosses below the signal line. MACD signals can be interpreted in various ways, but the most common methods are crossovers, divergences, and overbought/oversold conditions. 

    4. Relative Strength Index (RSI) 

    The Relative Strength Index (RSI) is a momentum indicator used to evaluate overbought or oversold conditions in the price of an asset. The RSI is displayed as an oscillator that moves between 0 and 100. Values above 70 are considered an indication that the asset is overbought and may be due for a trend reversal, while values below 30 indicate that the asset is oversold and may be undervalued. These levels are known as overbought and oversold lines. 

    The RSI shows a potential buy signal when the RSI crosses above the oversold line (30). A potential sell signal occurs when the RSI crosses below the overbought line (70). 

    With DB Investing’s tools, you can seamlessly integrate the RSI indicator into your analysis to identify market conditions and make well-timed trades. 

    How Are Technical Indicators Used in Trading? 

    Technical indicators can be used in various ways to enhance trading strategies: 

    • Confirming the Trend: The Moving Average and Exponential Moving Average help confirm the current market trend. 
    • Identifying Momentum: The MACD and RSI help identify the strength of momentum and potential reversal signals. 
    • Crossovers: Moving average crossovers and signal line crossovers in the MACD are used to generate buy and sell signals. 

    Conclusion 

    Technical indicators are powerful tools that assist traders in analyzing markets and making informed trading decisions. By understanding how these indicators work and how to apply them correctly, traders can improve their strategies and achieve better results in financial markets. 

    At DB Investing, we offer educational webinars and training courses covering the most important strategies used in financial analysis. You can register for them by clicking here.

     Blog – DB Investing – Dream Big Investing FSA and SCA regulated