In a bold move that sent shockwaves through global markets, U.S. President Donald Trump announced sweeping new tariffs targeting key trading partners. The new measures include a 25% tariff on all imports from Mexico and Canada, with a reduced 10% tariff on Canadian energy products. Additionally, a fresh 10% tariff on Chinese imports further escalates tensions with Beijing. Trump also hinted at similar actions against the European Union, signaling a potential widening of the trade conflict.
Immediate Market Reactions
The financial world responded swiftly and sharply to the news. As trading began in Asia on Monday, currencies and stock markets felt the immediate impact:
The Canadian dollar dropped 1.4%, reaching 1.473 CAD per U.S. dollar—its lowest level since 2003.
The Mexican peso plummeted over 2% to 21.15 pesos per dollar.
The euro weakened, losing 1% of its value against the U.S. dollar.
U.S. Stock Market Faces a Sharp Selloff
Investor sentiment in the U.S. also took a major hit. Futures tied to major U.S. indices fell dramatically:
Dow Jones Industrial Average futures dropped by 528 points (-1.01%).
S&P 500 futures slid 1.9%.
Nasdaq 100 futures faced the steepest decline, tumbling 2.7%.
These market movements underscore growing fears that the tariff increases could disrupt trade flows, hinder global economic growth, and introduce prolonged market instability.
What’s Next? Possible Market and Policy Responses
With markets on edge, attention now turns to how affected nations might respond:
Retaliatory Tariffs: Mexico, Canada, China, and the EU could impose countermeasures, leading to further trade tensions.
Diplomatic Negotiations: A push for new trade talks could ease investor fears, though no clear resolution is in sight.
Monetary and Fiscal Policies: Central banks and governments may introduce measures to stabilize economies and reassure investors.
Investor Strategy: Navigating Volatile Markets
For investors, heightened market uncertainty necessitates careful portfolio adjustments:
Diversification: Spreading investments across multiple asset classes can help mitigate risk.
Safe-Haven Assets: Gold, U.S. Treasury bonds, and other low-risk investments could offer stability.
Monitoring Trade Developments: Staying informed on diplomatic efforts and policy changes is crucial for making informed investment decisions.
Conclusion
Trump’s aggressive tariff strategy has rattled global markets, highlighting the interconnected nature of modern trade and finance. Investors must brace for continued volatility, with potential opportunities and risks unfolding in the coming weeks. As DB Investing continues to monitor these developments, staying proactive and adaptable remains key to navigating these uncertain times.
The gold market has once again made headlines, reaching a new record high amid global economic uncertainty. On January 30, gold prices surged to an all-time high of $2,800 per ounce, driven by strong demand for safe-haven assets and speculation over future Federal Reserve policies.
Why Did Gold Prices Surge?
Several factors contributed to gold’s latest rally:
🔹 Market Volatility & Economic Uncertainty
Global investors are turning to gold as a hedge against inflation and economic instability. With concerns over potential U.S. tariffs and geopolitical risks, gold remains a preferred asset for stability.
🔹 Federal Reserve & Interest Rate Speculation
Expectations surrounding the Federal Reserve’s next move on interest rates are influencing investor sentiment. Lower rates tend to boost gold prices, as they make non-yielding assets like gold more attractive.
🔹 Central Bank Buying & Strong Demand
Emerging market central banks continue to increase their gold reserves, further driving up prices. The long-term outlook remains bullish, with analysts predicting that gold could reach $2,850 per ounce by the end of 2.
Conclusion
Gold’s record-breaking surge to $2,800 per ounce highlights its resilience as a safe-haven asset amid global economic uncertainty. With inflation concerns, central bank buying, and speculation over Federal Reserve policies fueling the rally, investors are closely watching the market for future movements.
For traders, this presents both opportunities and risks. While gold remains a strong hedge against volatility, price fluctuations require strategic investment planning. At DB Investing, we provide expert insights and innovative trading solutions to help you make informed financial decisions.
Stay ahead of market trends—follow DB Investing for the latest financial updates!
Introduction General Overview of the Forex Market and Its Importance
The forex market (foreign exchange market) is the largest financial market in the world in terms of daily trading volume. It is characterized by its high liquidity and ease of access, making it one of the most attractive markets for investors and traders globally. The daily trading volume in this market is close to 8 trillion US dollars, providing immense opportunities for profit. However, it also carries high risks that require strong knowledge and prudent risk management.
Why is Forex Trading Attractive?
High Liquidity: Due to the large number of traders in the market, trades are executed quickly without delays. This liquidity helps reduce the bid-ask spread, which increases the chances of profit.
Flexibility in Trading: The forex market operates 24 hours a day, five days a week, allowing traders the flexibility to enter the market at any time that suits them. This flexibility allows trading outside of regular working hours or even at night, depending on the different time zones.
High Volatility: The high volatility in currency prices is an attractive feature for traders, offering greater opportunities for profit. However, this kind of volatility also increases the risk of loss.
Leverage: Leverage is one of the most important advantages of forex trading, allowing traders to control larger positions than the amount of capital they have. This can amplify profits, but it also increases the potential for losses if caution is not exercised.
Benefits for Traders
High Profit Potential: With tools like leverage, investors can achieve significant profits from even small price movements.
Diversity and Opportunities: The forex market offers a wide range of currency pairs to trade, providing varied opportunities for investors.
Continuous Learning Opportunities: Forex trading offers ongoing learning opportunities to improve skills, with access to educational resources like books, courses, and analytical articles that help traders refine their strategies.
What is Forex? Understanding the Forex Market The forex market is a global market where foreign currencies are traded. The term “Forex” is short for “Foreign Exchange.” In this market, currencies are exchanged for one another based on current exchange rates. The market is decentralized, meaning there is no physical location or centralized exchange for trading, but rather it occurs through a network of global banks and brokerage firms.
How Does the Forex Market Work? Forex works similarly to currency exchange when you travel to another country. When you exchange your local currency for a foreign currency, you are essentially participating in the forex market. If the currency you bought increases in value relative to the one you sold, you make a profit.
The forex market relies on supply and demand offers made by banks, financial institutions, and traders from around the world. Investors can trade currencies throughout the week from Monday to Friday, excluding weekends (Saturday and Sunday).
Currency Pairs in the Forex Market In the forex market, currencies are traded in pairs, where the value of one currency is compared to the other. Currency pairs are divided into three main categories:
Major Pairs: These pairs contain the US dollar as one of the two currencies and are the most traded. Examples include:
EUR/USD: Euro against the US Dollar
GBP/USD: British Pound against the US Dollar
Minor Pairs: These pairs do not include the US dollar. Examples include:
EUR/GBP: Euro against the British Pound
GBP/JPY: British Pound against the Japanese Yen
Exotic Pairs (or Rare Currencies): These consist of emerging market currencies such as the Turkish Lira or the Mexican Peso against major currencies like the US Dollar or Euro. Examples include:
USD/TRY: US Dollar against the Turkish Lira
EUR/ZAR: Euro against the South African Rand
Role of Currencies in the Global Economy Currencies play a vital role in international trade and investment, as no economic activity can be conducted internationally without using currencies. Exchange rates are determined by multiple economic factors such as:
Supply and Demand: When the demand for a currency increases, its value rises, and vice versa.
Monetary Policies: Central bank decisions regarding interest rates directly affect a currency’s value.
Political and Economic Stability: Countries with political and economic stability attract investors, leading to a rise in their currency’s value.
Forex Trading: Basic Concepts Key Forex Trading Terms To trade forex, there are several key terms every trader must understand, as they clarify the processes and strategies used in the market. Below are some important terms:
Price: The price of a currency determined by market supply and demand forces. The price is usually presented in a pair format, such as EUR/USD = 1.1800, meaning one Euro equals 1.1800 US dollars.
Spread: The difference between the bid price and the ask price. The ask price is the price at which a trader can buy the currency, and the bid price is the price at which the trader can sell it. For example, if the ask price for EUR/USD is 1.1805 and the bid price is 1.1803, the spread is 2 pips.
Pip: A pip is the smallest unit of price change in the currency market. Typically, it is the fourth decimal place. For example, if the price of EUR/USD moves from 1.1800 to 1.1801, it has increased by one pip.
Margin: The amount of money a trader needs to deposit as collateral to open a position. It is usually expressed as a percentage of the total trade size. For example, if the broker requires a 1% margin, the trader needs to deposit 1% of the total trade size to open the trade.
Leverage: Leverage is a feature that allows a trader to control a larger position than the amount of capital in their account. For example, if the leverage is 1:100, a trader can open a trade worth $100 for every $1 in their account. While leverage can magnify profits, it also increases the risk of losses.
Long & Short Positions:
Long Position: A position where the trader buys a currency expecting its value to rise.
Short Position: A position where the trader sells a currency expecting its value to fall.
Fundamental Analysis: This involves evaluating the economic and political situation of a country to predict currency movements. It includes studying factors such as interest rates, inflation, and GDP.
Technical Analysis: This involves studying charts and historical price data to predict future trends. It uses indicators like moving averages, momentum indicators, and more.
Why These Terms Matter Understanding these terms helps traders make better decisions in the market. Traders must be fully aware of how the spread, margin, and leverage affect their trades. Additionally, fundamental and technical analysis are essential tools for analyzing the market and making informed decisions about when to enter or exit a trade.
How Forex Trading Works How Are Currencies Traded? Forex trading relies on exchanging currencies in pairs. One currency is bought, and the other is sold at the same time. In other words, when you trade in forex, you are betting on the rise or fall in value of one currency relative to another. For example, if you think the value of the Euro will rise against the US Dollar, you would buy the EUR/USD pair. If the Euro’s value rises as expected, you can sell the pair for a profit.
Calculating Profits and Losses Profits and losses in forex are calculated based on the movement of prices and the number of pips the price moves. The pip, as mentioned earlier, is the smallest possible price change. The size of the profit or loss also depends on the trade size (lot size), which is the unit of measurement for trading in forex. For example, if the purchase price of EUR/USD is 1.1800, and it moves to 1.1820 when sold, you have made 20 pips. If the trade size is 1 standard lot (100,000 units of currency), each pip is worth $10, so your profit would be $200.
Types of Forex Orders Several types of orders can be used in forex trading:
Market Orders: Orders that are executed immediately at the current market price.
Limit Orders: Orders that are executed when the price reaches a specific level set by the trader.
Stop Loss Orders: Orders used to set a limit on how much loss a trader can tolerate.
Stop Orders: Similar to stop-loss orders but used to open a new position when the price reaches a certain level.
Benefits of Using Orders Using different types of orders helps traders manage risk better and increase their chances of making profits. Market orders provide quick access to the market, while limit orders and stop-loss orders help ensure that traders do not exceed the losses they are willing to accept.
In this first part of the comprehensive forex trading guide, we covered the basics of the forex market, how it operates, and how to trade currencies. We discussed how currency pairs work, as well as key trading terms used by traders in this vast market.
In Part Two, we will delve deeper into the details of the trading process, from how to get started in forex trading to the mechanics of buying and selling currency pairs. We will also explore potential risks and the best times to enter the market. Stay tuned for the continuation of this comprehensive guide to forex trading.
The Impact of Chinese Company DeepSeek on Nvidia and the Tech Sector
In recent days, U.S. markets have experienced sharp fluctuations, particularly within the technology sector, which was significantly impacted following the announcement by the Chinese company DeepSeek regarding the development of a new artificial intelligence (AI) model that promises higher efficiency and lower costs. This surprise announcement came at a time when major U.S. companies like Nvidia, Microsoft, and Alphabet (Google’s parent company) were leading the AI innovation race. This Chinese development caught investors off guard, leading to a drop in the stock prices of these companies, which directly affected key U.S. market indices.
DeepSeek’s Announcement and Its Sudden Impact
Chinese company DeepSeek caused a global stir with its announcement of a new AI model that relies on lower-cost and more efficient chips compared to those currently used in leading AI technologies. This move represents a real challenge for Nvidia, the world’s primary supplier of chips for AI applications. Reports indicate that the new chips developed by DeepSeek utilize innovative technologies that could potentially reduce the operational costs of AI models by up to 30%. This poses a direct threat to Nvidia’s sales and its ability to maintain its market position.
The Impact of the Announcement on Nvidia
Nvidia’s stock was significantly affected by the Chinese announcement, dropping 17% in a single day, resulting in a market value loss of approximately $600 billion. This drop marks one of the largest single-day market value declines ever recorded for a U.S. public company. The effect was not limited to Nvidia alone; it extended to other tech companies, raising concerns among investors about the ability of American companies to maintain their technological leadership in the face of increasing competition from China.
Market Reactions
Along with Nvidia’s stock drop, companies like Microsoft and Alphabet saw their stock prices fall by between 3% and 5%. As a result, the tech sector as a whole faced significant pressure, leading to a decline in the Nasdaq Composite Index, which focuses on tech companies, with major losses in the stocks of top tech firms. Conversely, some companies performed positively during this period, as investors turned to stocks in more stable sectors such as healthcare and consumer goods. For example, Johnson & Johnson’s stock rose by over 4%, making it a safe haven amid the market turbulence.
China’s Competitive Position
This development reflects the growing competition between China and the U.S. in the fields of AI and advanced technology. China has demonstrated its ability to develop innovative technologies that can seriously compete with U.S. innovations, raising concerns over the potential loss of the U.S.’s technological edge, which is a cornerstone of its economic strength. The ongoing competition is likely to escalate trade and political tensions between the two countries, with the U.S. possibly imposing further restrictions on its technological exports or on foreign investments in the American tech sector. Meanwhile, American companies face significant challenges in improving efficiency and reducing production costs to maintain their competitive edge.
What Lies Ahead for the Markets?
Considering these developments, U.S. markets are expected to remain under pressure in the coming days, with investors closely monitoring any new updates regarding Chinese competition or U.S. companies’ strategies to address this challenge. In the long run, U.S. companies, particularly Nvidia, are likely to accelerate their research and development efforts to deliver more efficient solutions in terms of both performance and cost. We may also witness broader collaboration between U.S. companies and the government to boost R&D investments, which would help ensure that they maintain leadership in this strategic field.
Conclusion
The recent events in U.S. markets reflect the sensitivity of the technology sector to global changes, especially when those changes involve competition with China. DeepSeek’s announcement is not just a technological news item, but a signal of a potential shift in the global technological balance of power. As this competition continues, American companies will be forced to rethink their strategies to ensure they remain at the forefront of this intense race.
At DB Investing, we understand that making informed decisions is key to success in trading. That’s why we’ve integrated a powerful new feature into our platform: the Signal Centre Tool. This AI-powered tool provides traders with real-time, data-driven signals that can help guide smarter trading choices and enhance overall strategies.
Why Use the Signal Centre Tool?
With the dynamic nature of the financial markets, having a reliable resource to inform your trading decisions is crucial. The Signal Centre Tool allows you to access real-time, high-quality trading signals that are personalized to suit your specific needs. Here’s what makes it stand out:
AI-Powered Signals: The tool generates signals using cutting-edge AI algorithms, ensuring accuracy and reliability in every signal.
Real-Time Insights: Get up-to-date information and react quickly to market changes.
Risk Management: Minimize your risks with advanced strategies and alerts tailored to your trading style.
Easy Access: Seamlessly integrate the Signal Centre Tool into your existing DB Investing platform for instant results.
How Can the Signal Centre Tool Help You?
Whether you are an expert trader or just starting, the Signal Centre Tool is an invaluable asset to your trading toolkit. Its AI-generated signals give you a competitive edge by providing timely, actionable advice for every trade you make.
We are excited to announce that DB Investing, your trusted partner in safe and regulated trading, will be attending the SVS Oman 2025 Expo on February 12–13, 2025, at the JW Marriott Hotel in Muscat, Oman.
Visit us at Booth 10 to discover how we’re revolutionizing the trading experience for investors worldwide!
This event brings together industry leaders, innovators, and professionals from around the globe to share insights, explore emerging trends, and build connections that shape the future of financial investments and trading.
Why Visit Us at SVS Oman 2025?
DB Investing is committed to empowering traders worldwide with cutting-edge tools, secure trading platforms, and unparalleled support. Attending this expo allows us to connect directly with our valued community and showcase our latest advancements in trading and financial solutions.
Connecting with us at SVS Oman 2025 will provide you with:
Insights into our platform
Access to exclusive resources for traders
Opportunities to meet our team and get your questions answered
Mark your calendars for February 12–13, 2025 and join us at the JW Marriott Hotel in Muscat. Don’t forget to stop by Booth 10 to explore how DB Investing is shaping the future of trading!
In a landmark decision, the Bank of Japan (BoJ) raised interest rates by 25 basis points, bringing them to 0.5%, the highest level seen since 2008. This marks the third rate increase since the central bank ended its long-standing negative interest rate policy in March 2024. The move signals the BoJ’s commitment to tightening monetary policy as Japan continues to navigate shifting economic conditions.
Gold Prices Climb Amid Dollar Pressure and Tariff Uncertainty
Gold prices have soared to their highest levels in nearly three months, with the metal heading for its fourth consecutive week of gains. Spot gold saw a rise of 0.7%, reaching $2,773.57 per ounce, translating to a weekly increase of over 2%.
The surge in gold prices is largely attributed to growing uncertainty surrounding President Donald Trump’s tariff plans, alongside his persistent calls for interest rate cuts. These factors have exerted downward pressure on the U.S. dollar, further bolstering the appeal of gold as a safe-haven asset in times of economic and political turbulence.
Oil Prices Dip Following Trump’s Call for Lower Costs
Oil markets experienced a downturn on Friday after President Donald Trump urged OPEC and Saudi Arabia to reduce prices and ramp up crude production. Brent crude futures declined by 50 cents to settle at $77.95 per barrel, while U.S. West Texas Intermediate (WTI) crude dropped by 31 cents to $74.31 per barrel.
The President’s comments reflect concerns about elevated energy costs and their potential impact on global economic activity. Market participants are now closely monitoring OPEC’s response to these developments.
U.S. Stock Markets Scale New Heights
U.S. equities continued their upward momentum, with the S&P 500 index achieving a new record high during Thursday’s trading session on January 23. President Donald Trump’s remarks advocating for lower interest rates and oil prices appear to have bolstered investor sentiment.
The S&P 500 gained 0.5%, while the Nasdaq Composite rose by approximately 0.2%. The Dow Jones Industrial Average also surged by 408 points, or 0.9%, marking its fourth consecutive day of gains. These movements highlight the resilience of the U.S. stock market amid mixed global economic signals.
Conclusion
The global financial landscape is in a state of flux, shaped by significant developments across key markets. The Bank of Japan’s rate hike signals a shift in Japan’s monetary policy approach, while gold’s rise underscores investor caution in the face of economic uncertainty. Meanwhile, oil’s decline reflects ongoing geopolitical pressures, and U.S. stocks continue to demonstrate impressive growth. As these trends unfold, market participants must stay attuned to policy changes and global economic shifts to navigate the complexities of the current environment effectively.
Have you ever considered trading Contracts for Difference (CFDs) in the stock market? How can you get started? To answer this question, investors must deeply understand the stock market. With a comprehensive understanding of this market, they can confidently take their first steps in their investment journey. Building an investment portfolio in stocks is quite like constructing a building. This article will provide further details about this construction process so readers can better understand it before embarking on such an adventure.
Initial Plan for CFD Trading in the Stock Market
Whether you are an engineer or an investor, the first step begins with comprehensive study and meticulous research to establish an initial plan. Engineers need to identify locations, required materials, and potential risks, while investors must:
Set Clear Financial Goals: First, investors need to clearly define their goals. This requires them to study the available options and determine which one suits them best. At this stage, beginner traders are encouraged to consult experts and learn their opinions and predictions regarding CFDs for stocks they are interested in.
Clearly Define Their Risk Tolerance: To establish a strong plan, every investor must identify their risk tolerance. To do this successfully, they need to set clear points about the capital they wish to invest, the amount they are willing to risk, and the profits they expect to earn. One good strategy in this regard is to calculate the risk-to-reward ratio, aiming for three wins for every loss. At DB Investing, we offer a variety of webinars on capital management and risk management.
Set Realistic Expectations for CFD Trading in the Stock Market: Building a solid plan is certainly not done overnight. It requires considerable time and ongoing analysis of the latest trends. By regularly following updates, investors can better adapt to market fluctuations.
Building a Solid Foundation for CFD Trading in the Stock Market
After engineers establish their initial plan, they begin to build the foundation of their project, carefully selecting the key materials. The same applies to stock CFD investors, who select the right stocks to include in their investment portfolio to make it stronger.
Top 10 US Stocks to Consider:
MSFT (Microsoft): Microsoft, the tech giant, is almost universally known. The company’s performance looks promising, especially as it invests heavily in innovation and research to continuously update its products.
AAPL (Apple): Apple is one of the largest global companies, with highly popular products. The company has achieved significant success in the stock market, making it a great growth option for portfolios.
NVDA (NVIDIA): Another company attracting significant investments is NVIDIA, a leader in graphics processing units and integrated circuits. With high demand for its products and its current focus on AI, NVDA shares could offer promising opportunities.
AMZN (Amazon): Amazon is a staple in many people’s daily lives, making it a thriving e-commerce company. This makes its stock an attractive investment option.
GOOGL (Alphabet): Google, one of the largest and most well-known global companies, has a relatively high trading volume, which could potentially bring returns to investors.
META (Meta): Meta, the world’s largest social platform, has become an integral part of our daily lives. Its shares could provide good opportunities for investors.
BRK.B (Berkshire Hathaway): This company primarily focuses on property and casualty insurance and reinsurance. Additionally, it provides services in utilities and energy, rail transport, finance, manufacturing, retail, and more.
LLY (Eli Lilly): Based in Indiana, Eli Lilly has offices in around 18 countries, enabling it to deliver pharmaceutical products to approximately 125 countries.
TSM (Taiwan Semiconductor Manufacturing Company): TSM is the second-largest semiconductor manufacturer in the world. Its high value attracts a large number of investors.
AVGO (Broadcom): Broadcom is a global technology company offering a wide range of semiconductor solutions, enterprise software, and security. It could be a good addition to an investment portfolio.
Choosing the Right Tools for CFD Trading in the Stock Market
After engineers have outlined the plan and built the foundation, they need to select the tools that will help them implement it. Similarly, investors are advised to choose the right tools to start trading after building their strategy and selecting the stocks they want to invest in. Traders can use various platforms and tools to implement their plans. Here are some popular platforms and tools for buying and selling stocks through CFDs:
MetaTrader 5 (MT5) from DB Investing: The MT5 platform offers all the benefits of MT4 and adds more. It allows technical analysts to conduct precise price analysis across a wide variety of assets. It also supports more asset categories than MT4, making it a better option for stock trading. You can open a real trading account with DB Investing by clicking here.
Copy Trading: Copy trading is a tool available in financial markets. Instead of building unique trading strategies, which take time and effort, users can copy the trades of successful investors and benefit from their expertise. This tool provides users with information about the performance of professional traders, making it a valuable resource for those looking to improve their trading skills. You can benefit from copy trading services with DB Investing by clicking here. If you’re an experienced trader, you can also offer your services on the same platform.
Starting the Execution Process for CFD Trading in the Stock Market
After building the plan, selecting stocks, and choosing trading tools, it’s time to start the execution process.
Choose a Trusted Broker for CFD Trading in the Stock Market: To enhance the CFD trading experience, investors can compare the offers of different brokers. Choosing a good broker should be based on specific criteria, such as being highly regulated, offering a wide range of products, providing tight spreads, fast execution, excellent platforms and tools, and 24/7 customer support.
Open a Demo Account to Practice CFD Trading: Investors can start practicing CFD stock trading using a demo account. The demo account allows users to test their strategies with virtual funds, enabling them to refine their approach without taking real risks.
Open a Real Account: A demo account can indeed build a trader’s confidence and offer a hands-on experience without risking real money, encouraging them to start investing real funds. However, traders must approach real trading cautiously, ensuring they have a strong understanding of the market and apply proper risk management strategies to protect their investments.
Monitor Trades: When placing orders, traders should stay updated with the latest news and market updates. By continually monitoring trades, traders can adapt to changing market conditions and improve their investment decisions to achieve better returns.
The Importance of Risk Management in CFD Trading in the Stock Market
Investing in CFD stocks requires studying and analysing the market and building a strong trading strategy. After creating the strategy, investors can practice using a demo account to gain a better understanding of the market, thereby reducing potential risks. Additionally, traders should avoid risking more than they can afford to lose, apply stop-loss orders, and carefully review costs like commissions and spreads. Adhering to these practices can contribute to a more informed and responsible approach to CFD trading in the stock market.
On January 20, 2025, Donald Trump returned to the White House, taking office as President of the United States for the second time. This return was marked by fiery statements and bold decisions that stirred controversy both nationally and internationally. However, what drew the most attention was not just his political agenda but the launch of two meme-based digital currencies by Trump and his wife, Melania. This move sparked intense debates about the influence of political figures on cryptocurrency markets and the risks these investments pose to individuals.
Trump’s Statements: A New Golden Era or Renewed Challenges?
In his inaugural address, Trump declared the beginning of a “new golden era” for America, promising to rebuild the economy and revitalize the domestic energy industry. Among his most controversial statements and decisions were:
Overturning the Previous Administration’s Policies: In an effort to erase the legacy of his predecessor, Trump signed executive orders to repeal 78 measures from Joe Biden’s administration, emphasizing the need to realign policies with his vision for America.
Freezing Regulatory Measures: Trump issued an order to freeze all new regulatory measures, stressing the need for a comprehensive review of existing policies to ensure alignment with his administration’s goals.
Ending Remote Work for Federal Employees: Trump directed the end of remote work policies for federal employees, insisting on their return to offices to enhance efficiency and productivity in government operations.
Withdrawing from the Paris Climate Agreement: Trump announced the United States’ withdrawal from the Paris Climate Agreement, arguing that the pact imposes unjustified restrictions on the American economy.
Declaring a National Emergency on the Mexican Border: Trump declared a national emergency on the southern border, outlining plans to deploy additional forces and enhance border security to curb illegal immigration. He also pledged to resume construction of the border wall and deport undocumented immigrants.
Liberalizing the Energy Sector: Trump declared an energy emergency, committing to removing restrictions on oil and gas extraction, including hydraulic fracturing (fracking), approving new pipelines, and reducing environmental regulations to boost energy independence.
Presidential Pardons: Trump signaled his intent to pardon participants in the January 6, 2021, Capitol riot, asserting the need to revisit their cases.
These statements reinforced Trump’s image as a populist leader committed to restoring America’s economic and political dominance. Yet, amidst these political developments, Trump and Melania introduced a digital project that shocked financial markets.
Meme Coins: “Trump Coin” and “Melania Coin” Take the Spotlight
In an unexpected move, Trump and his wife launched two meme-based digital currencies, aptly named “Trump Coin” and “Melania Coin.” These coins were part of a marketing strategy leveraging Trump’s popularity and substantial influence over his support base.
The coins witnessed a meteoric rise upon their launch. “Trump Coin” saw its value surge by over 1,000% within hours, fueled by social media promotions. Similarly, “Melania Coin” achieved record-breaking numbers in its initial days, becoming a hot topic in financial and media circles.
However, this success was short-lived. The coins experienced a dramatic crash, losing more than 80% of their market value within days. This sudden collapse highlighted the risks associated with meme coins, which heavily rely on trends and fleeting fame without any substantial projects backing their value.
Meme Coins: Opportunity or Trap?
Meme coins, like “Trump Coin,” belong to a category of digital currencies driven by internet trends and social memes. Famous examples include “Dogecoin” and “Shiba Inu,” which have also experienced rapid surges in the past. However, the biggest challenge with meme coins lies in their lack of tangible value or economic foundation.
Key Risks of Meme Coins:
Volatility: Their value heavily depends on social engagement, making them susceptible to abrupt crashes.
Lack of Supporting Projects: Most meme coins are not tied to robust technological or economic initiatives.
Emotional Investing: These coins attract investors seeking quick profits, often without adequate research or understanding of the risks involved.
Trump’s foray into digital currencies reflects these challenges vividly. While “Trump Coin” witnessed an initial frenzy, its rapid downfall proved it to be a short-lived economic bubble.
A Warning to Investors: Caution is Essential
The story of “Trump Coin” and “Melania Coin” serves as a powerful reminder to investors that the digital market, despite its allure, is fraught with risks. To invest wisely in this space, consider the following tips:
Conduct Research: Avoid investing based solely on trends or popularity. Understand the project behind the digital currency.
Steer Clear of Emotional Decisions: Don’t let advertisements or celebrity endorsements drive your investment choices.
Invest Cautiously: Allocate only a small portion of your funds to such coins and be prepared for potential losses.
Conclusion
Between his bold statements and the launch of meme coins, Donald Trump demonstrated how the intersection of politics and the digital economy can create both opportunities and risks. While some cryptocurrencies aim to deliver innovative solutions, meme coins remain a high-risk investment, often driven by rumors and trends. Investors must approach this market with wisdom and caution, recognizing that true success lies not in chasing bubbles but in deliberate planning and a long-term vision.
Elliott Wave Theory represents one of the most important tools in technical analysis of financial markets. This theory relies on a recurring pattern of movements that reflect the psychology of investors over time. It is an integral part of understanding how prices move across different markets, whether in forex, stocks, or commodities.
Ralph Nelson Elliott discovered this theory in the 1930s when he noticed that markets move in specific, predictable patterns based on the psychological changes of market participants. Elliott believed that markets do not move randomly but follow defined patterns that can be read and analysed to predict future price movements.
The Scientific Basis Behind the Theory
Elliott Wave Theory is based on the principle that market movements are not random but follow common psychological cycles. According to Elliott, these cycles consist of impulsive waves that move in the direction of the primary trend of the market and corrective waves that move against it.
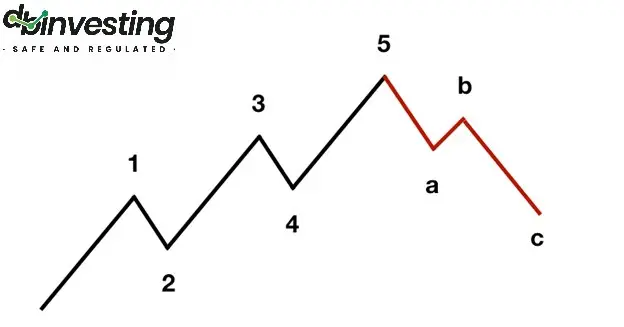
Impulsive Waves
Impulsive waves represent movements that move in the same direction as the market’s primary trend. These waves consist of five smaller waves, three of which move in the direction of the trend, and two are corrective.
Wave One: This is the beginning of a new trend. This wave usually starts when investors begin buying after a period of market oversold conditions. This wave is often unclear to most investors, as it is considered a part of the correction rather than a new trend.
Wave Two: This is a corrective wave following the first wave. It could be a slight pullback in the market as some investors take profits after the initial movement, but it doesn’t fully reverse the preceding upward movement.
Wave Three: This is the longest and strongest of the waves. At this stage, most investors recognize that the market is in a new upward trend, which drives them to buy heavily, resulting in a significant rise in prices.
Wave Four: This represents another corrective wave after the strong third wave. This wave is usually less severe than the second wave.
Wave Five: This is the final phase of the impulsive movement. It can be weaker than the third wave, but it marks the end of the upward trend before the full correction begins.
Corrective Waves
After the impulsive waves end, the market enters a corrective phase consisting of three waves, known as the corrective waves (A-B-C).
Wave A: This is the beginning of the correction after the fifth wave ends. At this stage, investors begin taking profits, leading to a drop in prices.
Wave B: This is an upward retracement within the corrective trend. Some might believe that the market will resume its upward trend, but it is a corrective wave within the correction.
Wave C: This is the final stage of the correction, where the correction is completed, and prices decline further, setting the market up for a new impulsive wave.
Fractals and Wave Patterns
One of the distinguishing features of Elliott Wave Theory is the concept of fractals. This refers to the fact that each impulsive and corrective wave consists of smaller waves within it. For example, Wave One could be made up of five smaller waves, with each of those smaller waves following the same structure as the larger waves. This makes the market analysable at multiple time frames, from short periods like minutes to long periods such as years.
The Relationship Between Elliott Waves and Fibonacci Elliott Wave Theory is closely linked to the Fibonacci sequence. The theory uses Fibonacci ratios to predict potential reversal or correction points in the market. For example, ratios like 38.2% and 61.8% can be used to identify key support and resistance levels. Often, corrective waves end at these levels.
How to Use Fibonacci Ratios with Elliott Waves When the market completes an impulsive wave (Waves 1-5), traders can use Fibonacci ratios to determine potential corrective levels for the A-B-C wave. For example, if a trader expects the market to enter a corrective phase, they can draw Fibonacci ratios from the top of Wave Five to the bottom of Wave One to identify possible correction levels.
Applying Elliott Waves in Trading Elliott Waves is a powerful analytical tool that can be used to identify optimal trading opportunities. By understanding the wave movements, traders can pinpoint the best entry and exit points in the market. Here are some examples of how to apply Elliott Waves in trading:
Identifying the Market’s Main Trend By analyzing the impulsive and corrective waves, traders can determine whether the market is in an uptrend or downtrend. When the five-wave pattern is completed, a corrective phase can be expected, providing an opportunity for traders to take advantage of the upcoming trend.
Capitalizing on Corrections Elliott Waves can be used to forecast potential correction levels. For instance, if a trader expects that the market has completed an impulsive wave, they can use Fibonacci ratios to identify possible correction levels for the A-B-C wave.
Optimal Timing for Entry and Exit When the wave pattern is completed, it can serve as a signal for traders to enter or exit the market. For example, if Wave C is completed, it can signal a market entry, as traders expect the market to begin a new impulsive phase.
Combining Elliott Waves with Other Technical Indicators The accuracy of Elliott Wave predictions can be enhanced by using them alongside other technical indicators. For example, traders can use moving averages or the Relative Strength Index (RSI) to better identify entry and exit points.
Practical Examples of Applying Elliott Wave Theory
Example 1: Trading a Correction After an Uptrend in EUR/USD Let’s take an example from the forex market. If you are trading the EUR/USD pair and notice that the price has risen significantly over several weeks, you can analyze this rise using Elliott Waves. The movement can be broken down into five impulsive waves, and once Wave Five is completed, a potential correction phase may begin. Once Wave Five is complete, Fibonacci ratios can be used to identify potential correction levels. If the price retraces to the 61.8% level, it may signal that the market has completed its correction and is about to enter a new impulsive wave.
Example 2: Uptrend in Tesla Stock When trading Tesla’s stock, the price may begin an upward movement after a positive earnings announcement. The movement can be broken down into five impulsive waves according to Elliott Waves. Wave One represents the beginning of the new trend after a period of consolidation, and Waves Three and Five continue to push prices higher with strong momentum. During these waves, traders can enter buy positions in each impulsive wave, increasing their chances of profit.
Challenges of Applying Elliott Wave Theory Despite its numerous benefits, traders may face some challenges when applying Elliott Wave Theory:
Difficulty in Accurately Identifying Waves Identifying waves accurately can be challenging, especially in volatile markets. The market may display confusing patterns, making it difficult to determine which wave the market is currently in.
The Need for Extensive Experience Elliott Wave Theory requires a substantial amount of knowledge and experience. Traders need to carefully analyze the market and rely on personal judgment, which may lead to differing interpretations among analysts.
Relying on Other Tools Elliott Wave Theory may not be sufficient on its own. Traders need to combine it with other analytical tools to confirm their predictions and avoid losses.
Criticisms of Elliott Wave Theory Despite its popularity, Elliott Wave Theory has been criticized by some traders and analysts. They argue that the theory can be overly complex and relies on subjective interpretations. Some critics believe that attempts to identify waves may be prone to errors in volatile markets. However, many traders still consider this theory a valuable analytical tool that helps them understand market movements and capitalize on trading opportunities.
Conclusion Elliott Wave Theory is a powerful analytical tool that provides a framework for analysing recurring market movements. Although it faces some challenges, when used correctly, it can be extremely useful in analysing financial markets and identifying optimal trading opportunities.
At DB Investing, we believe that mastering this tool can empower traders to make informed decisions and capitalize on market opportunities. Whether you’re a novice or an experienced trader, incorporating Elliott Waves into your strategy could be the key to unlocking your trading potential.